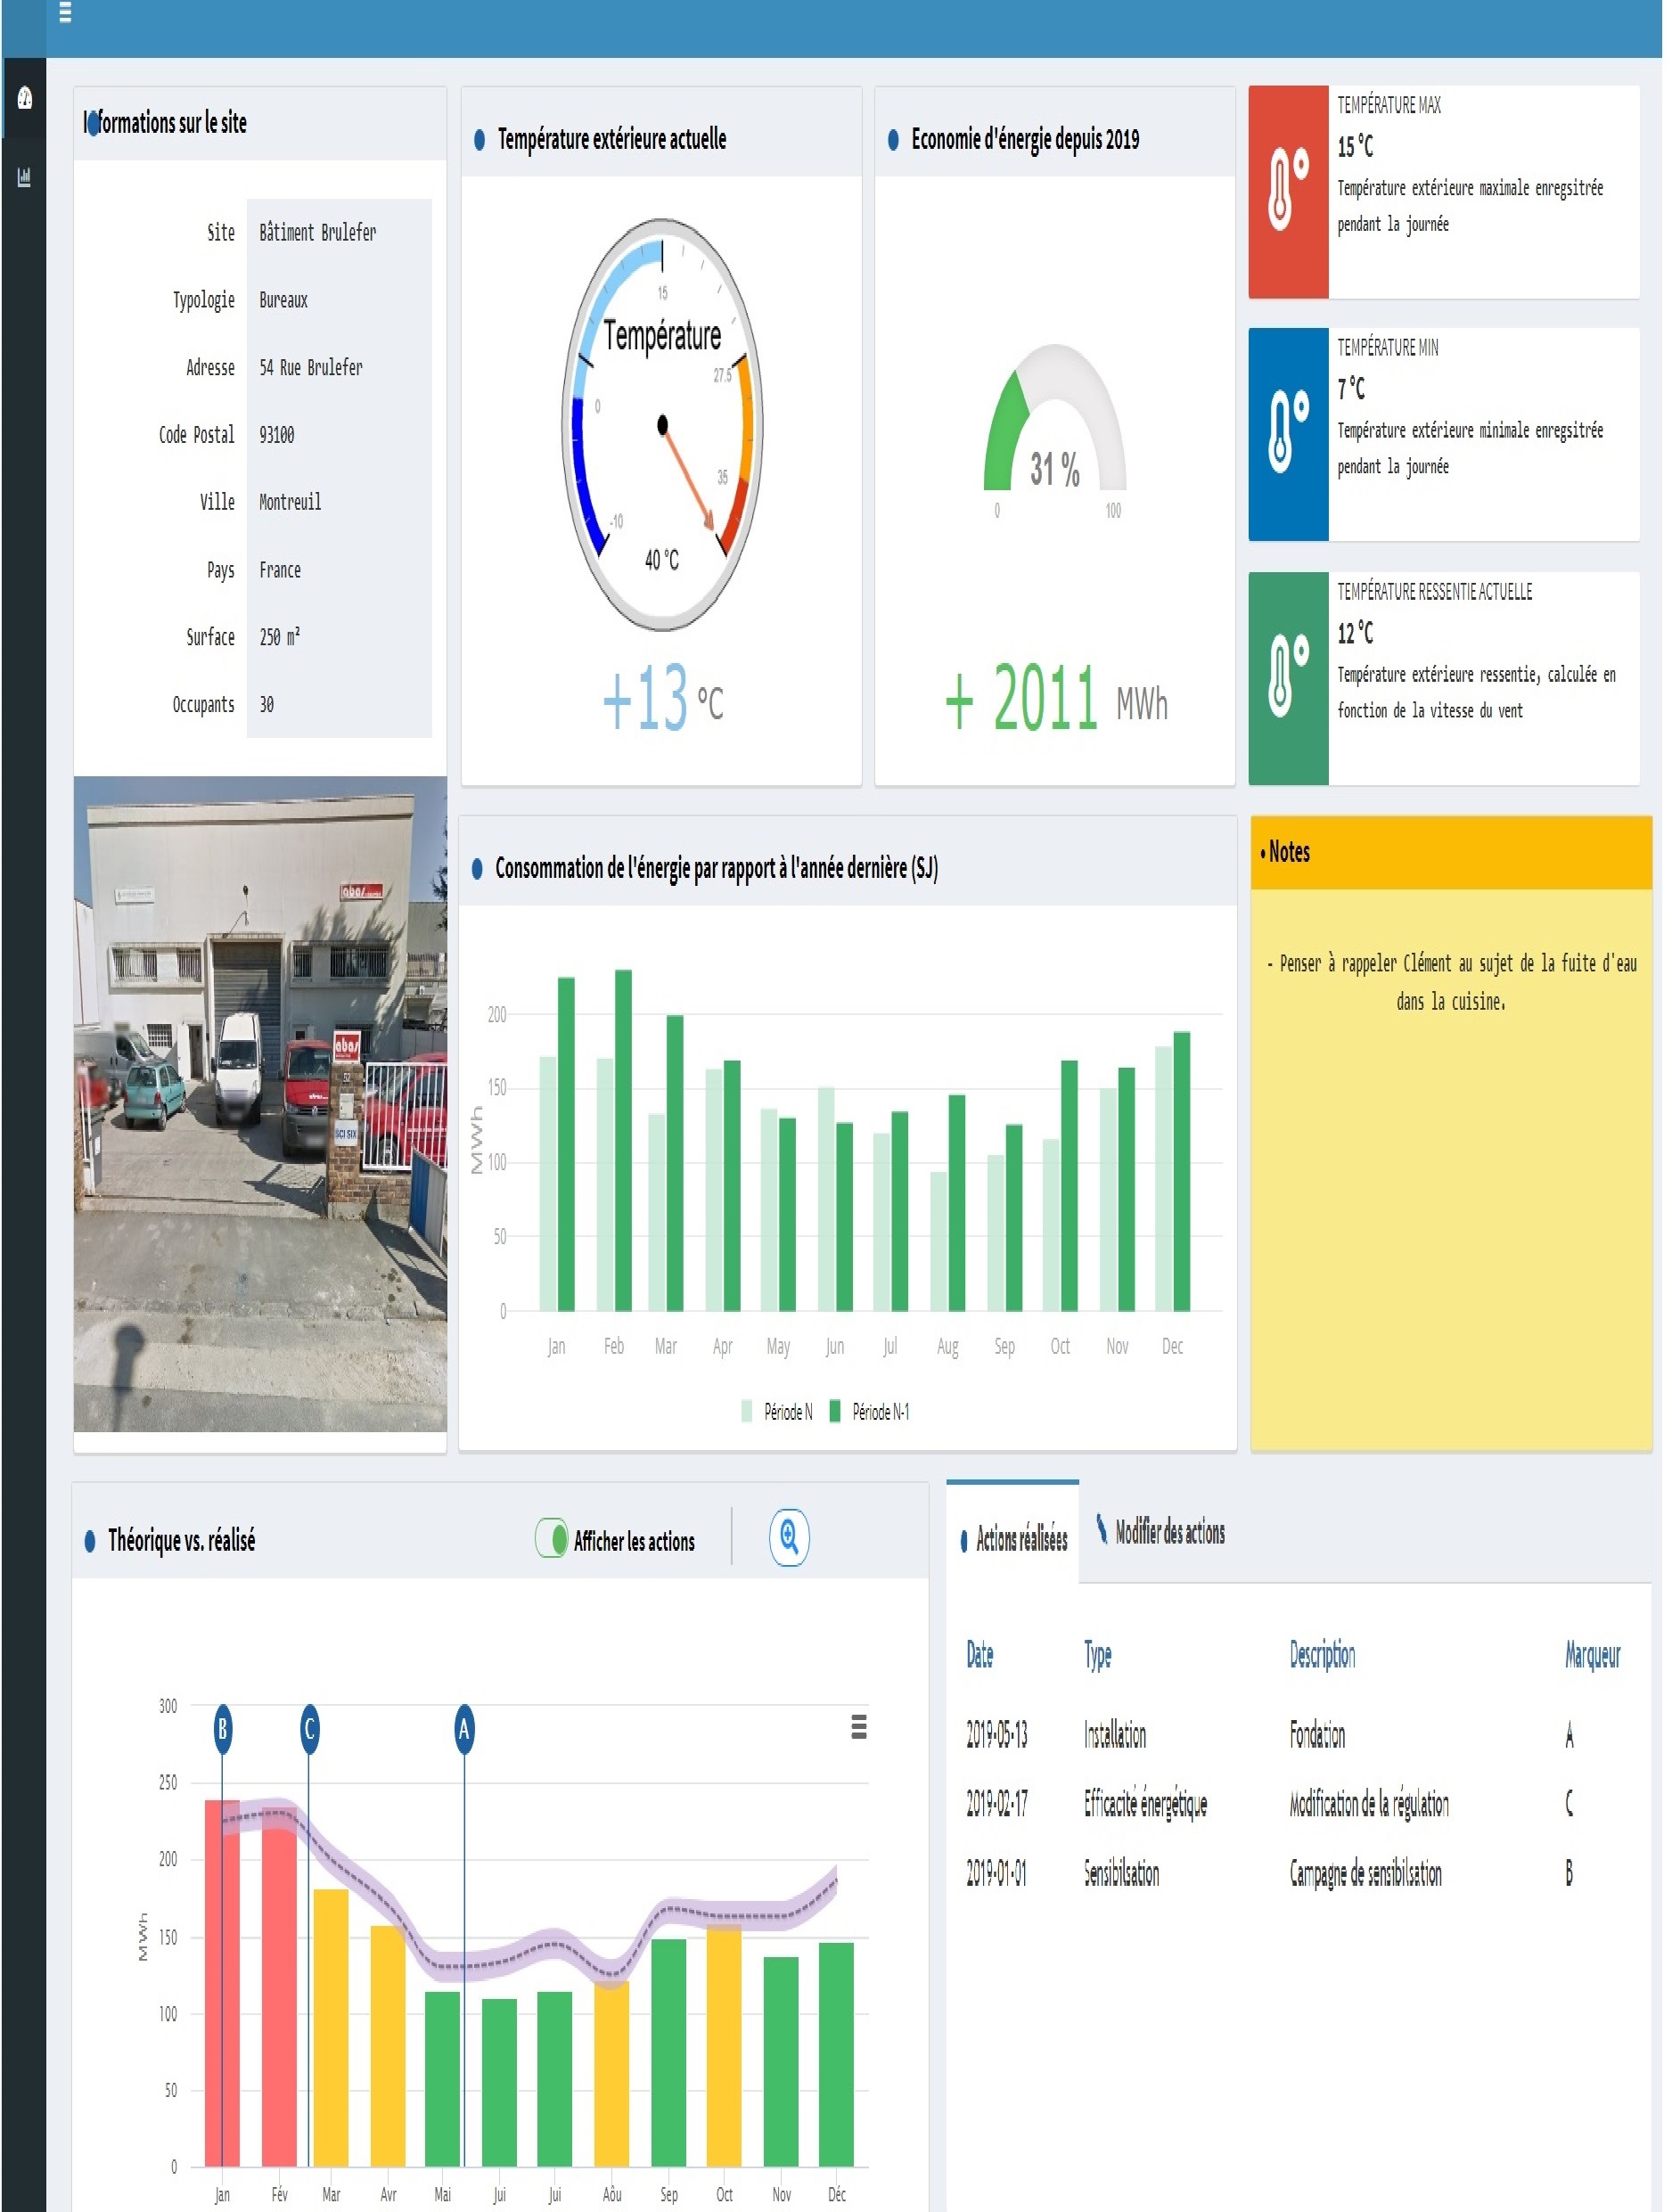
Originally coming from a nuclear physics background. I worked for several years as a Data Scientist and R Shiny progammer in a few fields (Healthcare, energy, sports, ...).
I decided in 2021 to continue my Data Science journey as a freelancer. I have since worked for several international clients that I helped to improve their businesses using data and R Shiny, a perfect tool that combines the statistical and analytical power of R and the interactivity of the modern web.
I specialize in providing R software development, Shiny app design and Data Consulting services. My primary tool is R, which I use extensively in conjunction with Python and SQL.
Ahmed JOU
9 Rue de l'étoile
Toulon, 83000 France
+33 7 67 11 77 63
ahmed.jou@datarmy.com
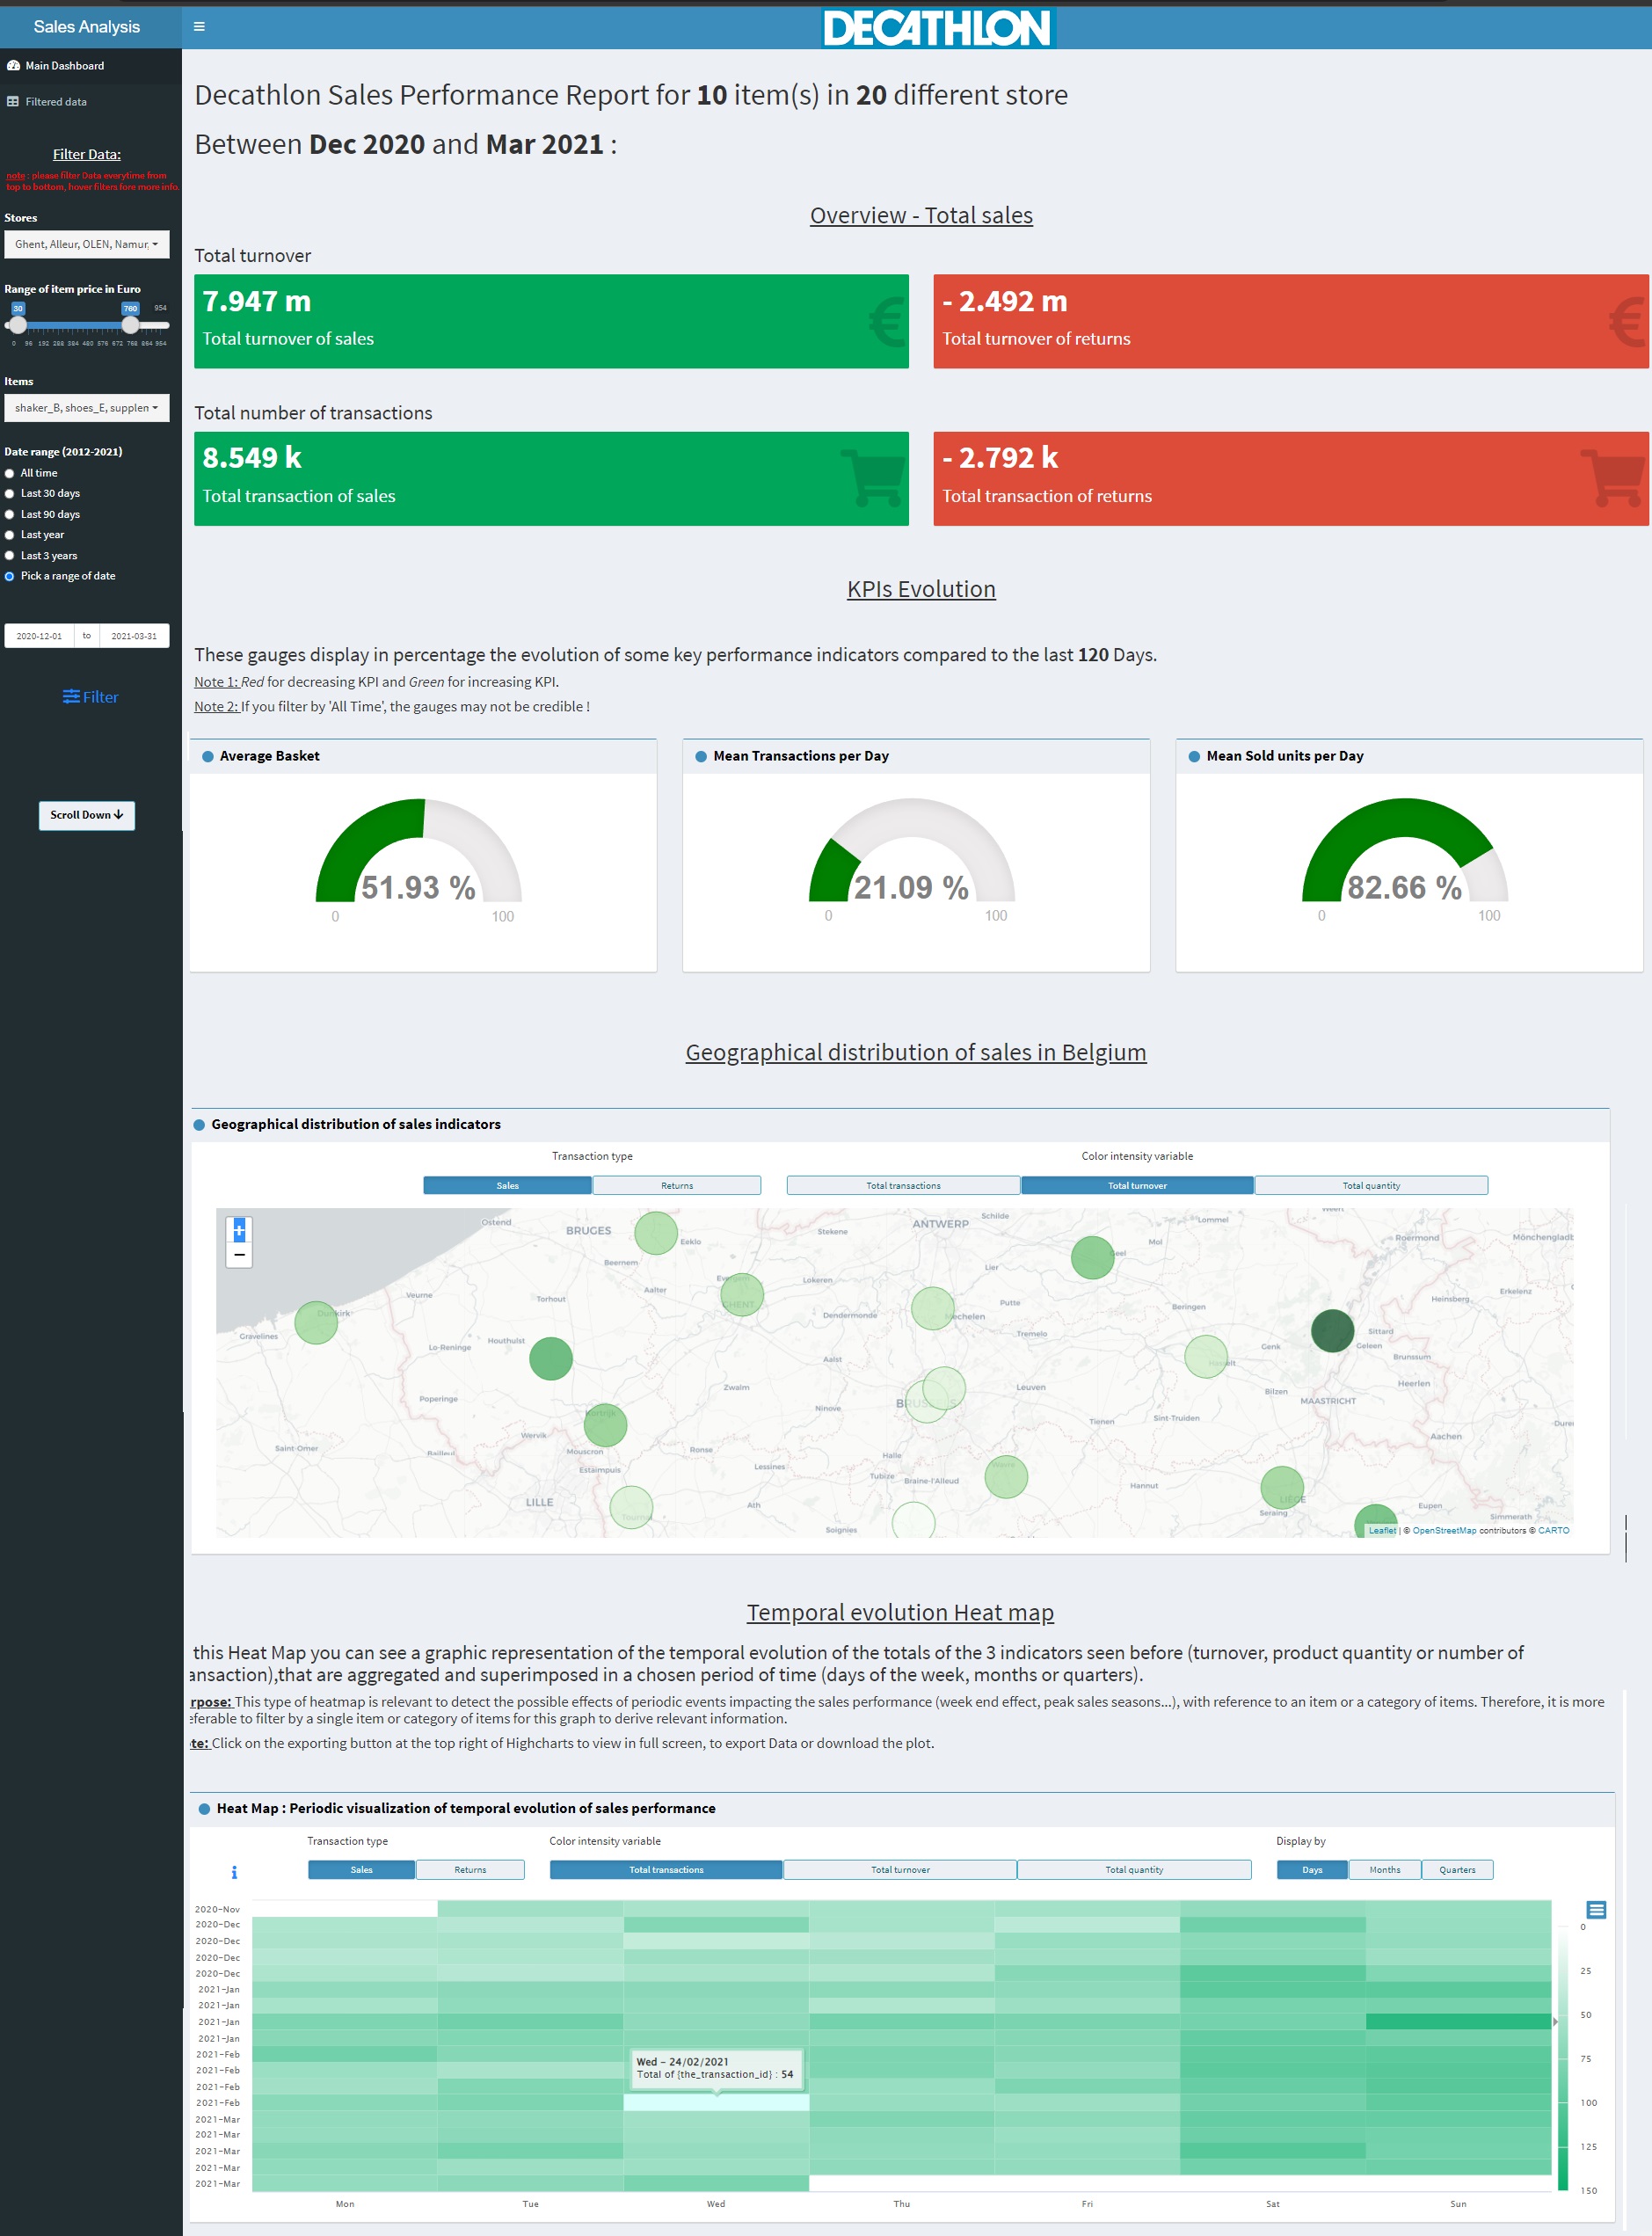
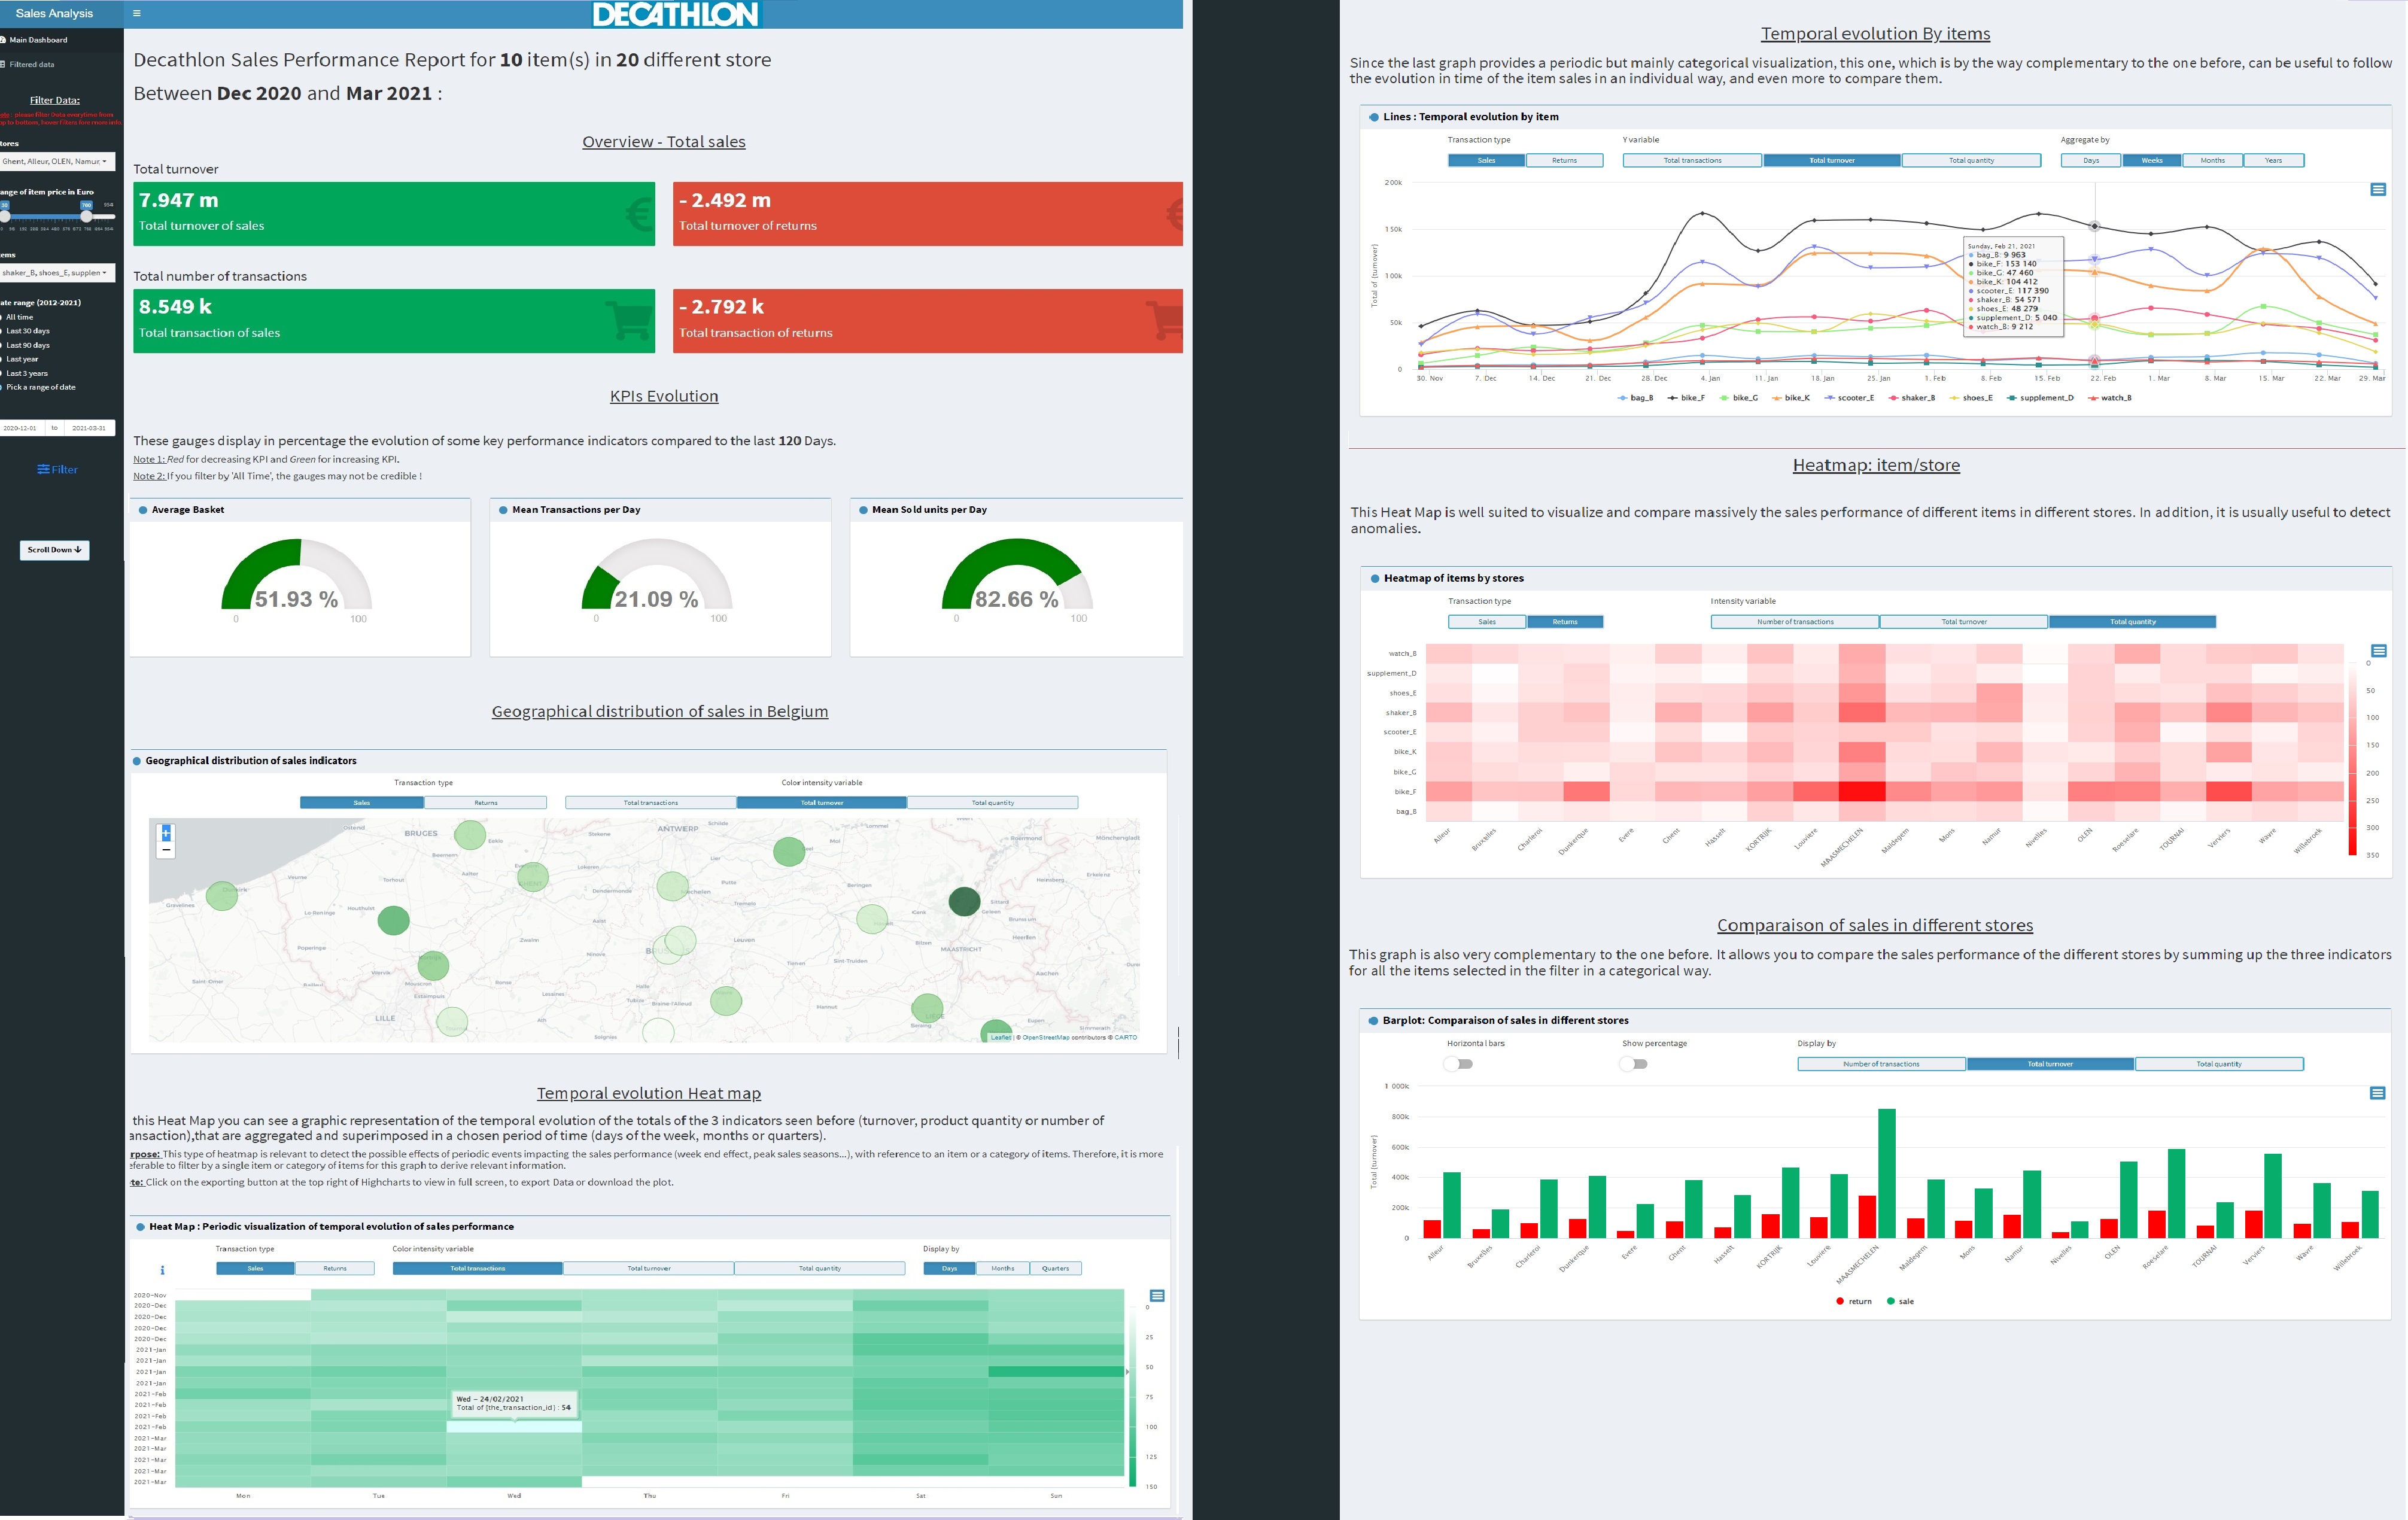
This is an R Shiny dashboard that I developed in the context of a hiring competition at Decathlon Belgium. It renders the KPIs of anonymized data of the company. R Packages used for visualization: {Highcharts}, {leaflet}...
Project link: https://ahmedjou.shinyapps.io/Decathlon_Sales_Analysis/
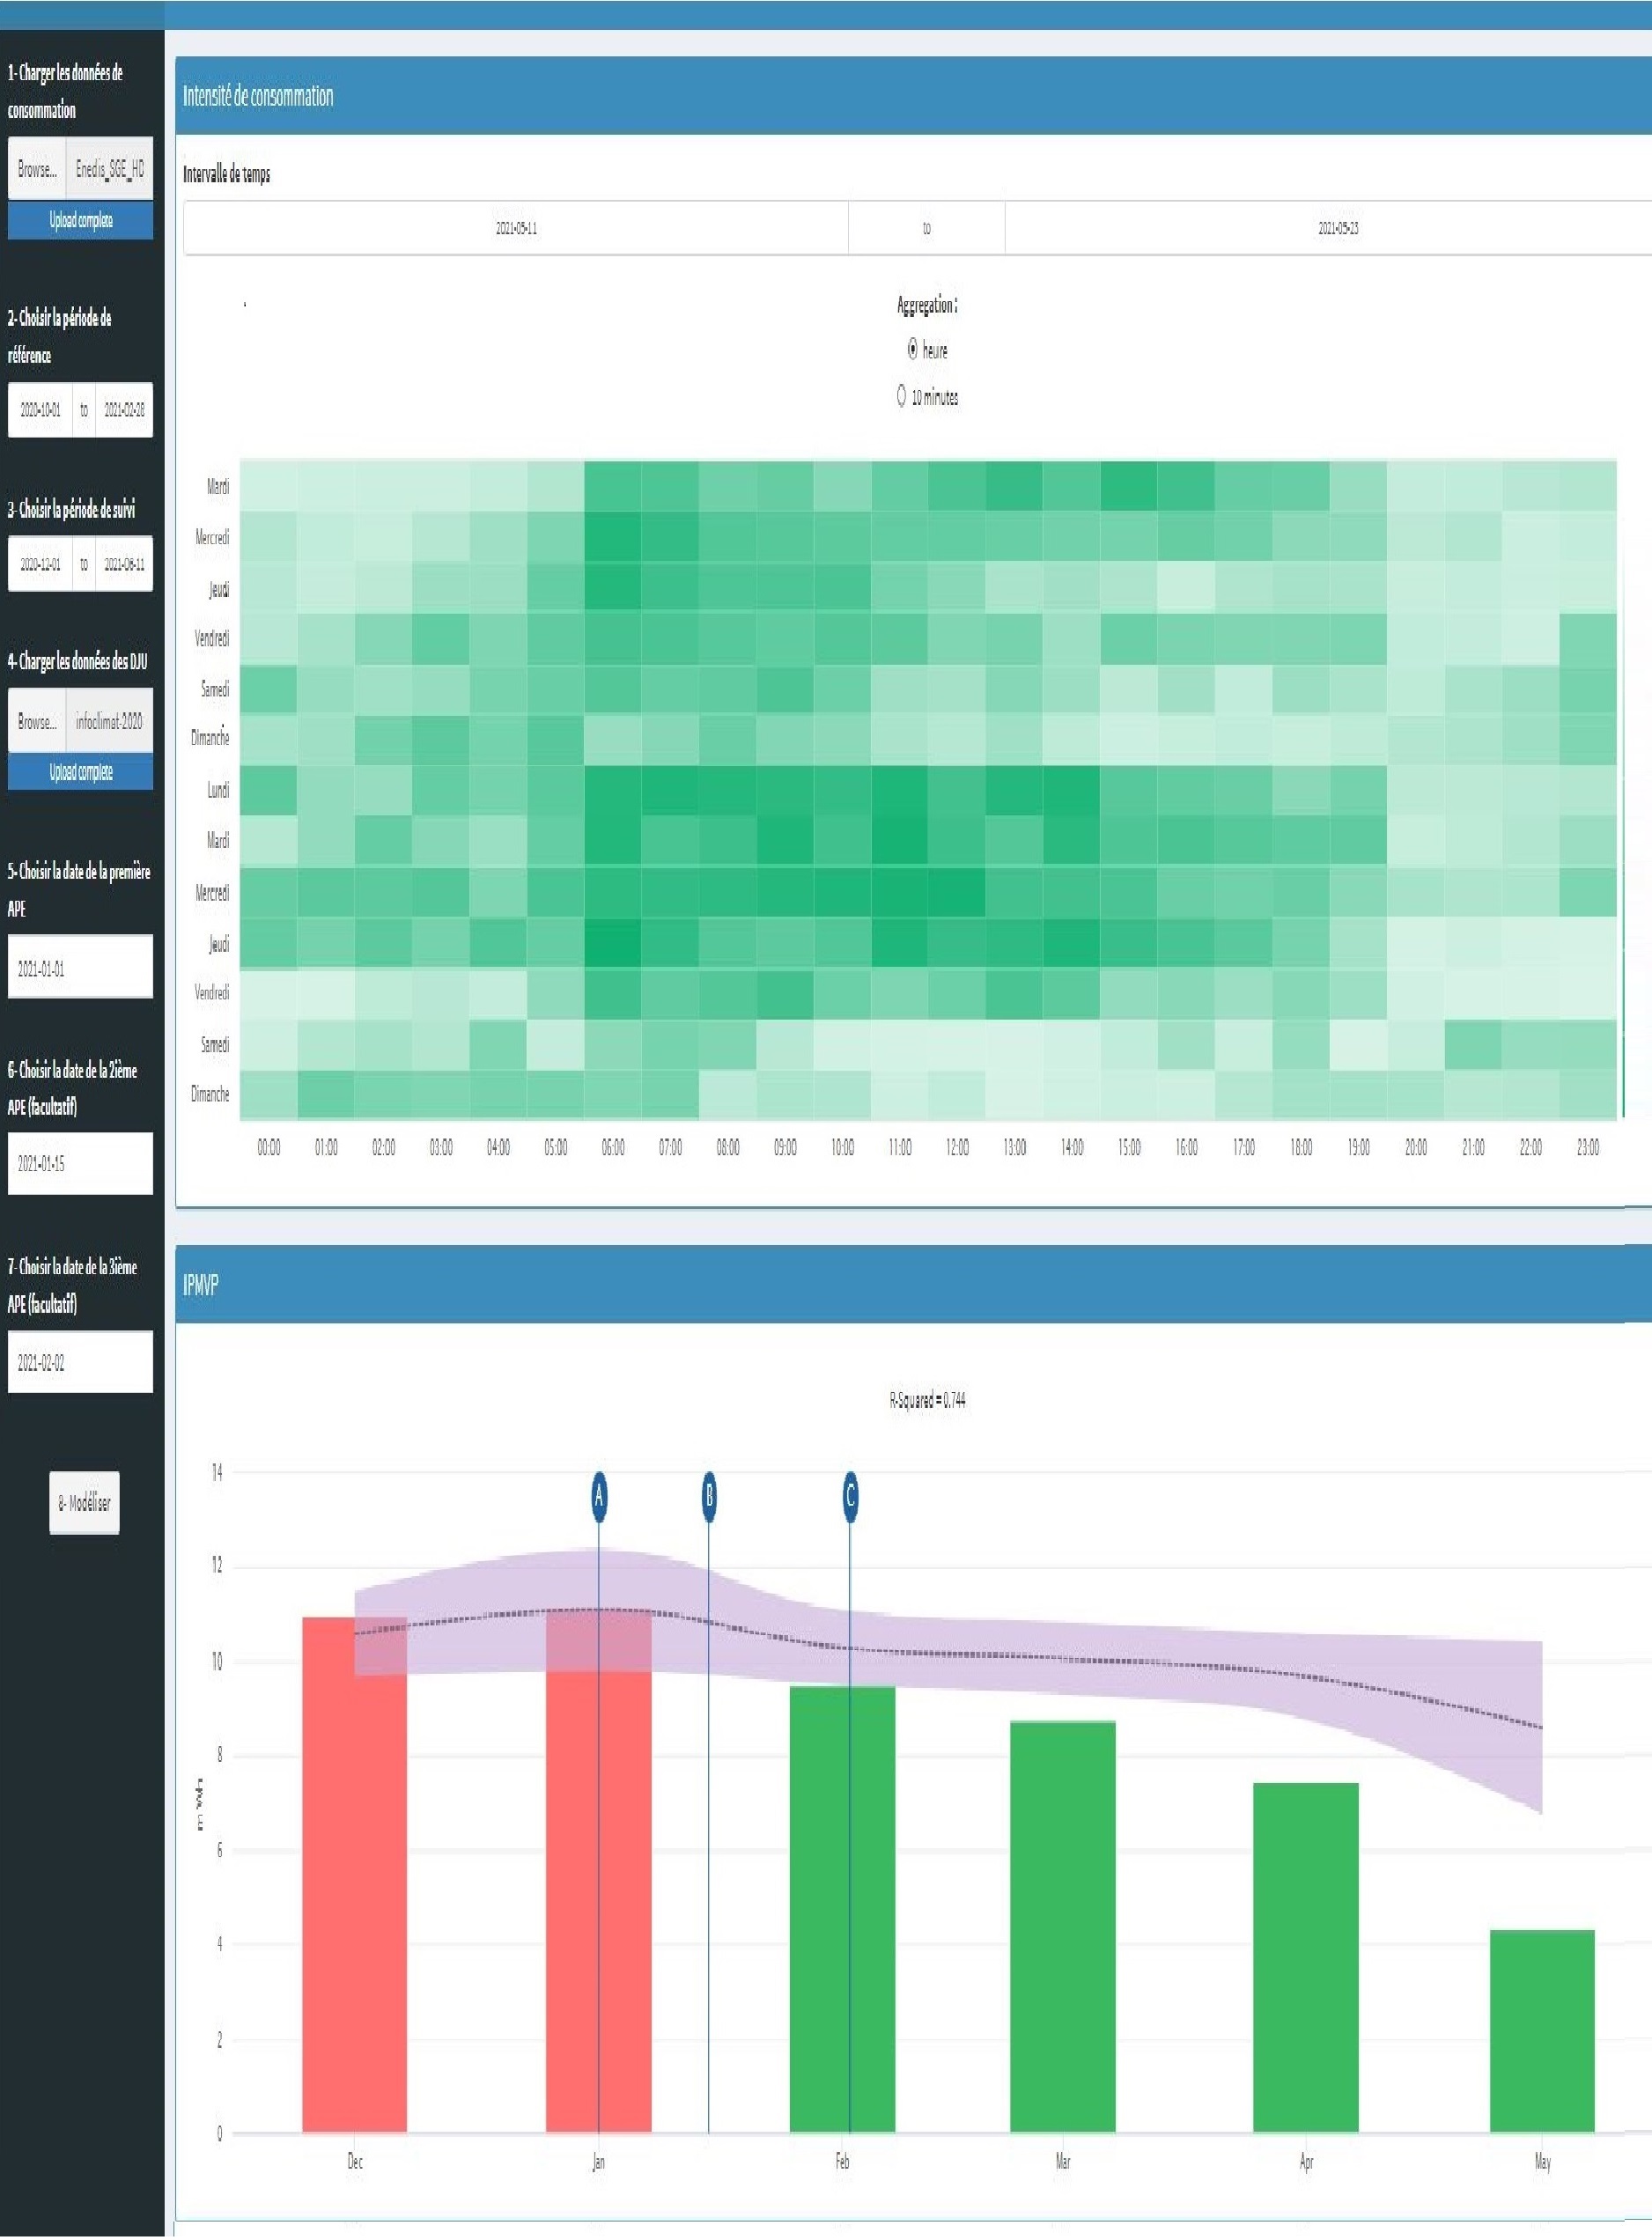
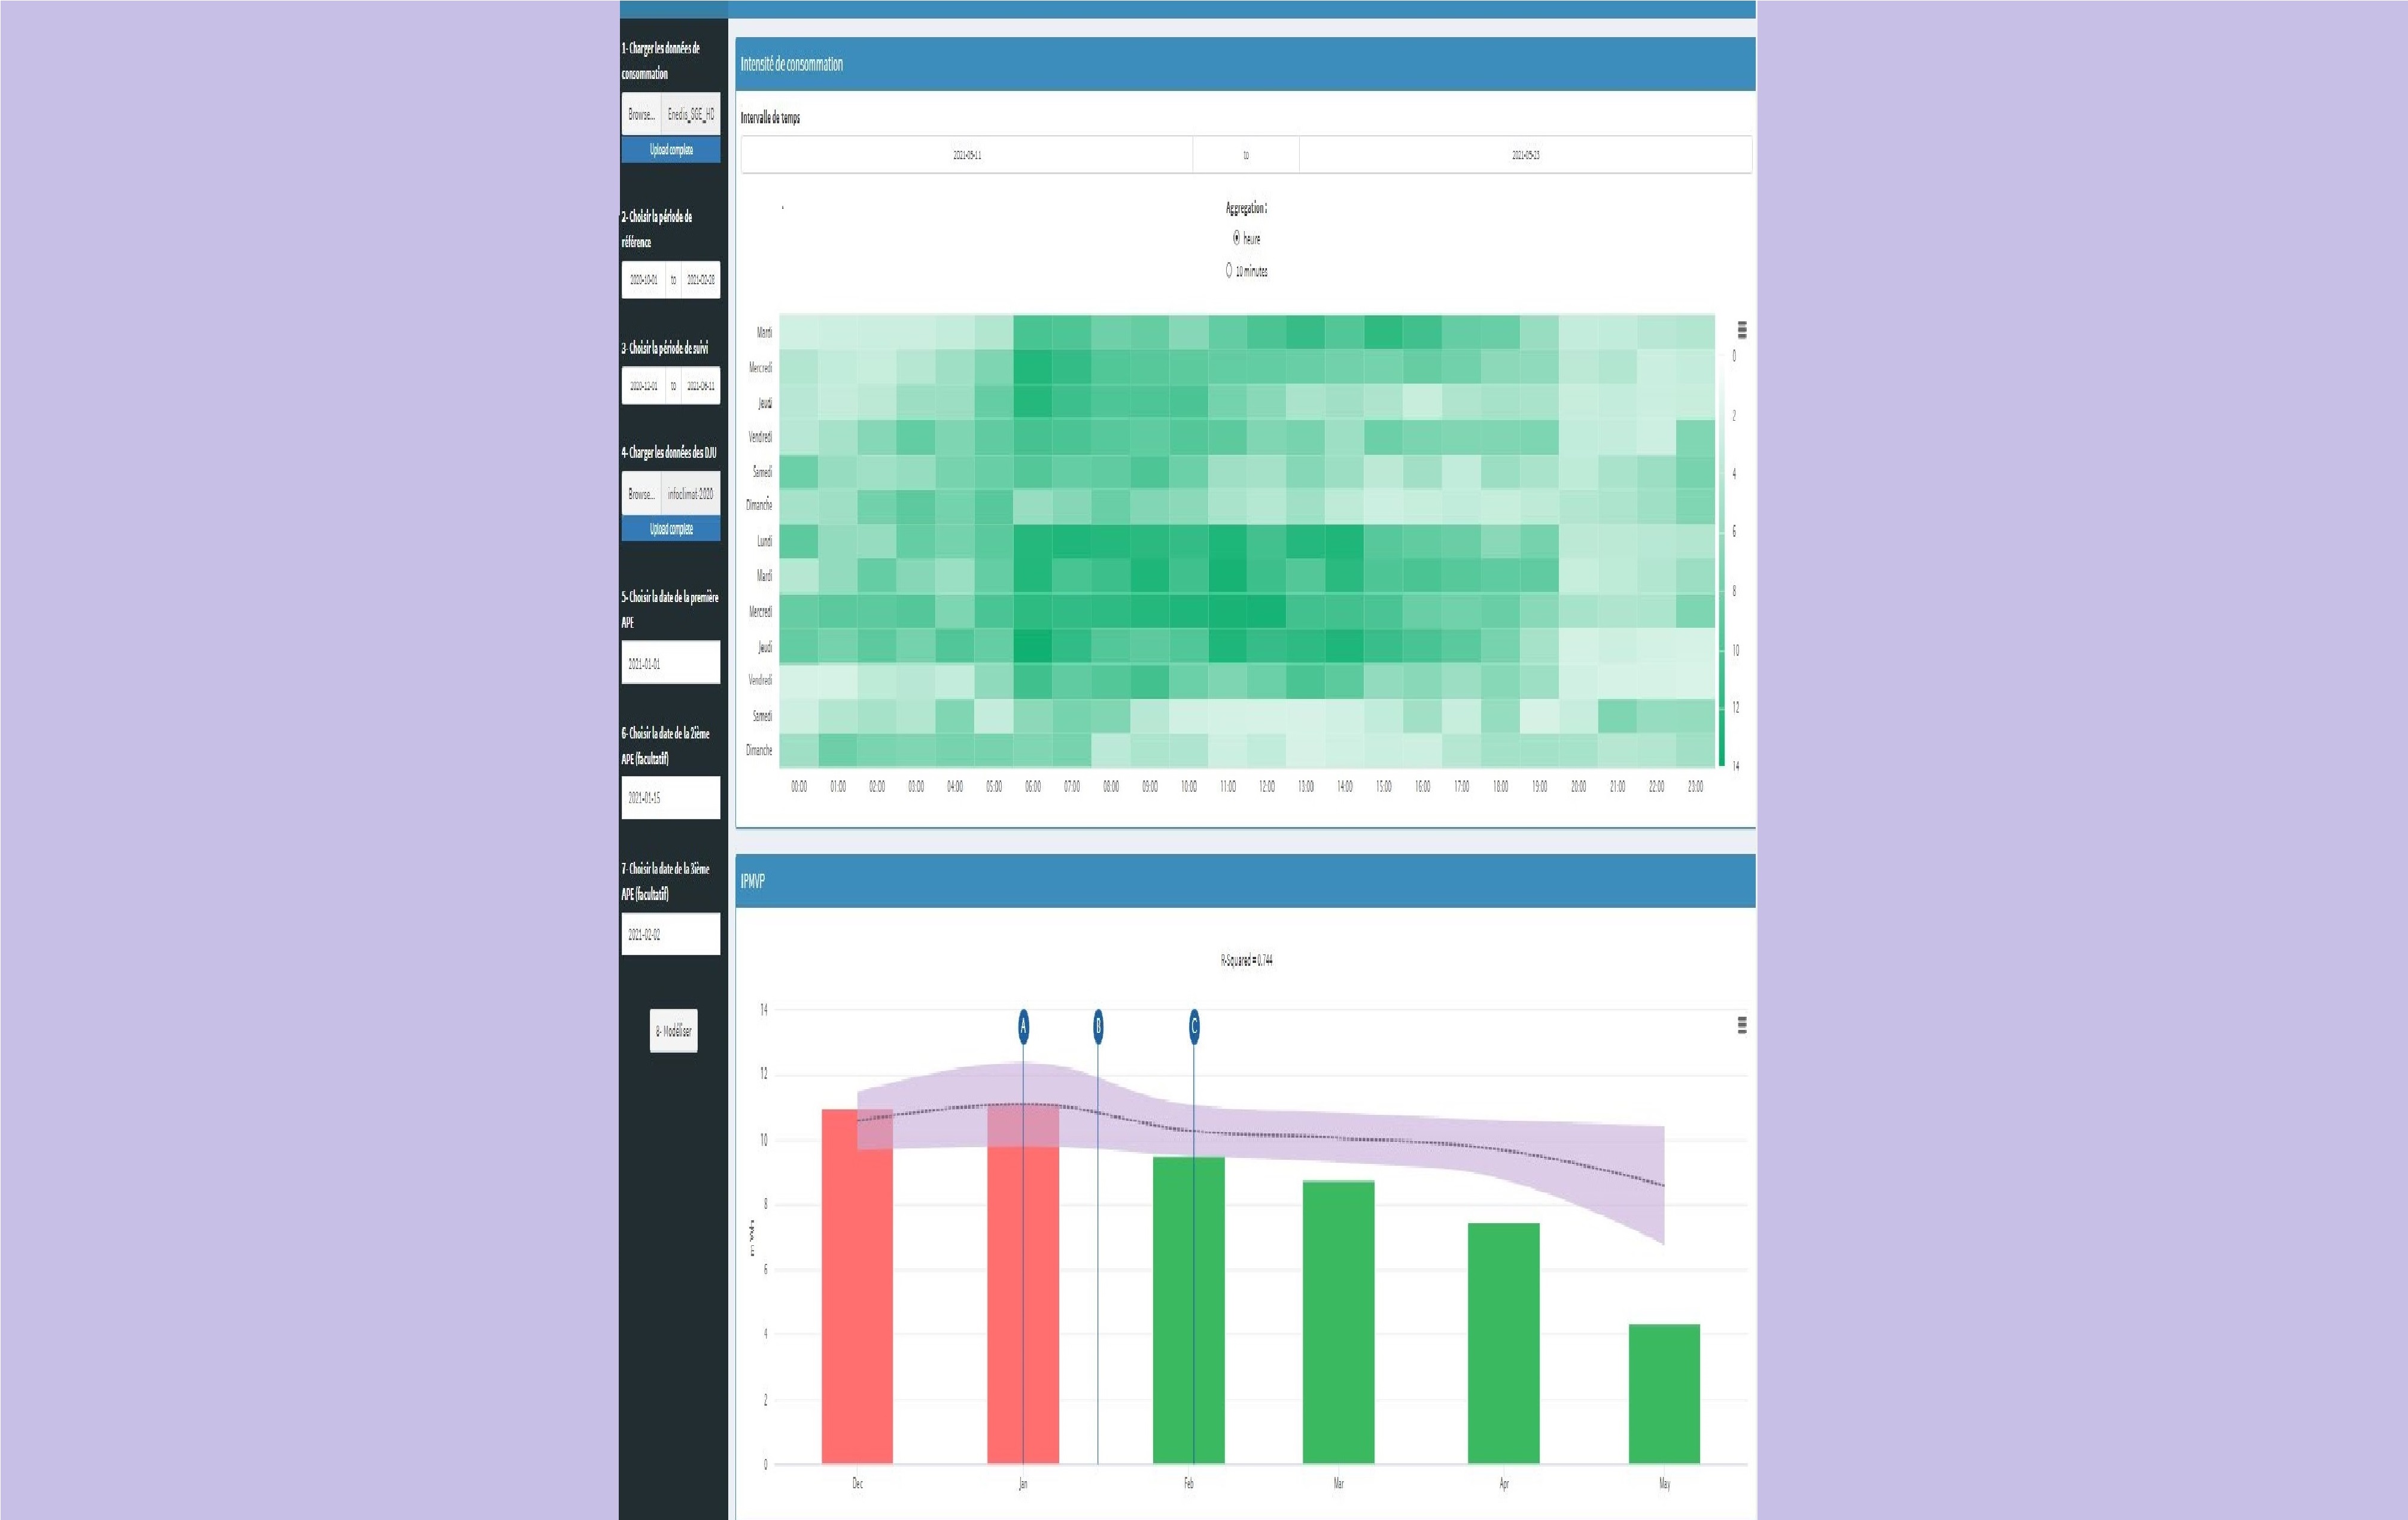
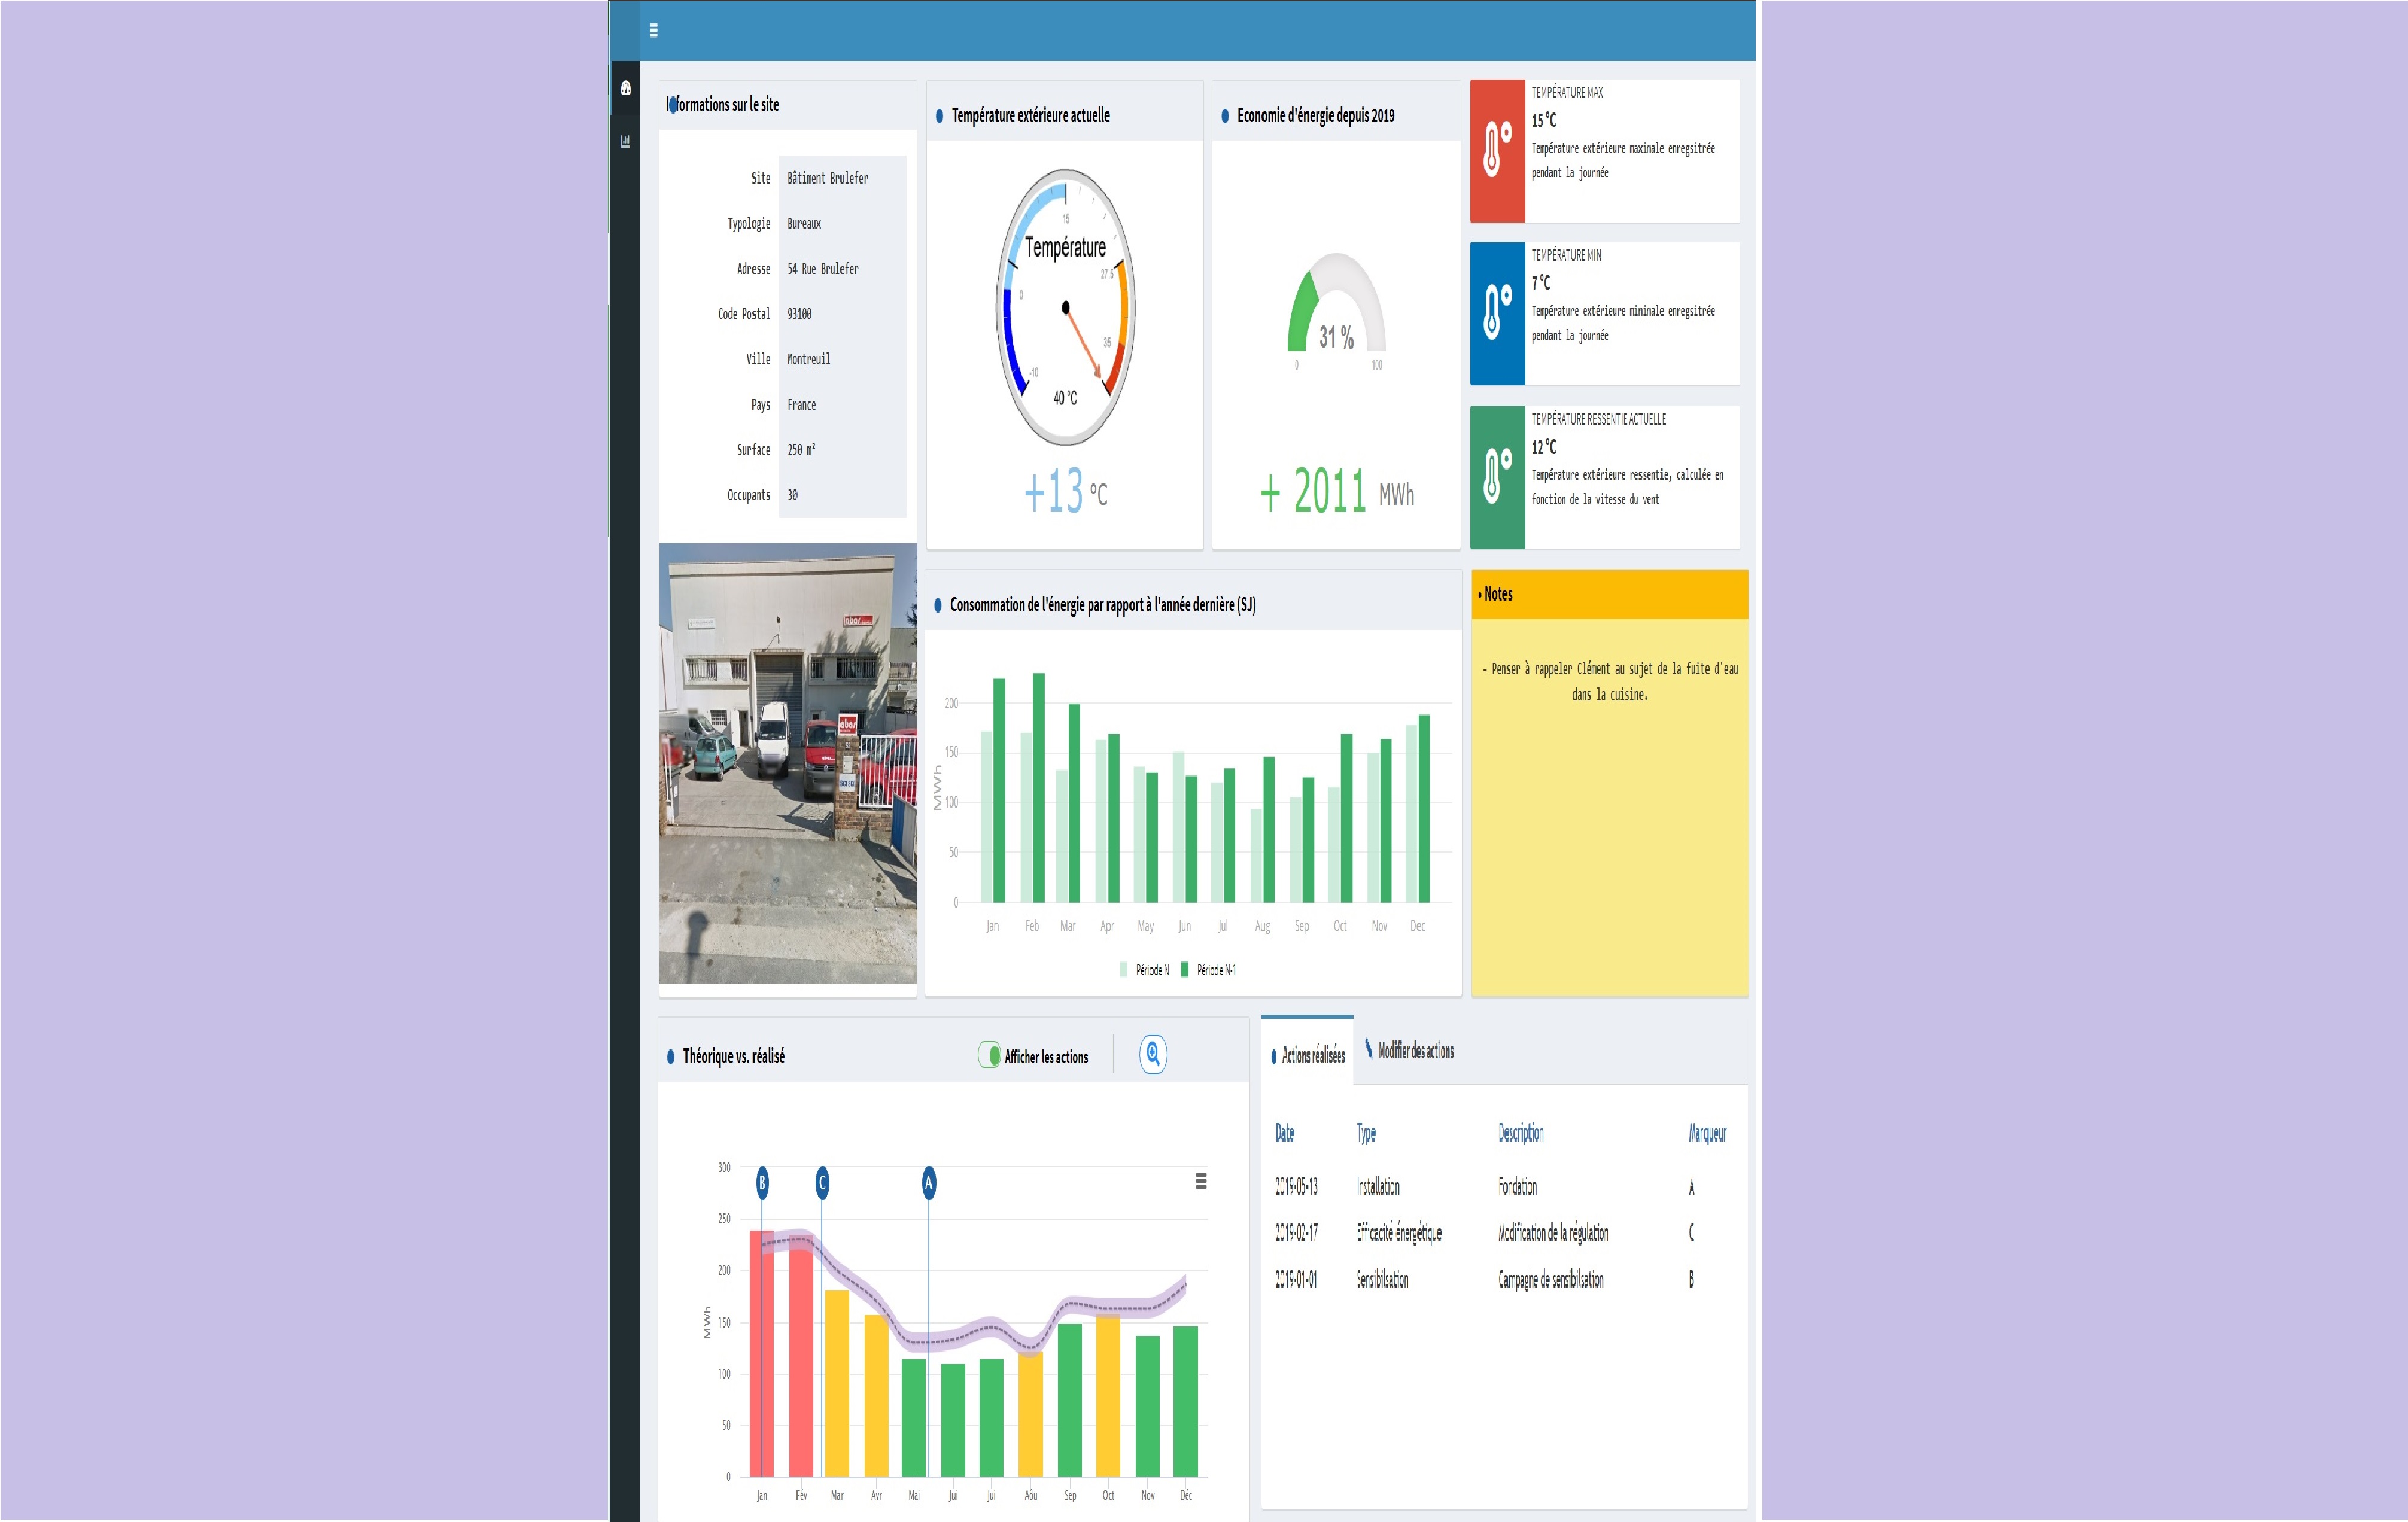
This dashboard, developed for one of my clients in the energy field provides two main features. Firstly, analyzing on a daily basis their customers' electrical consumption in order to detect any anomaly. Secondly, applying the IPMVP model which simplifies the M&V process and improves the credibility of their energy efficiency projects.
Project link: https://ahmedjou.shinyapps.io/AnalyseConso/
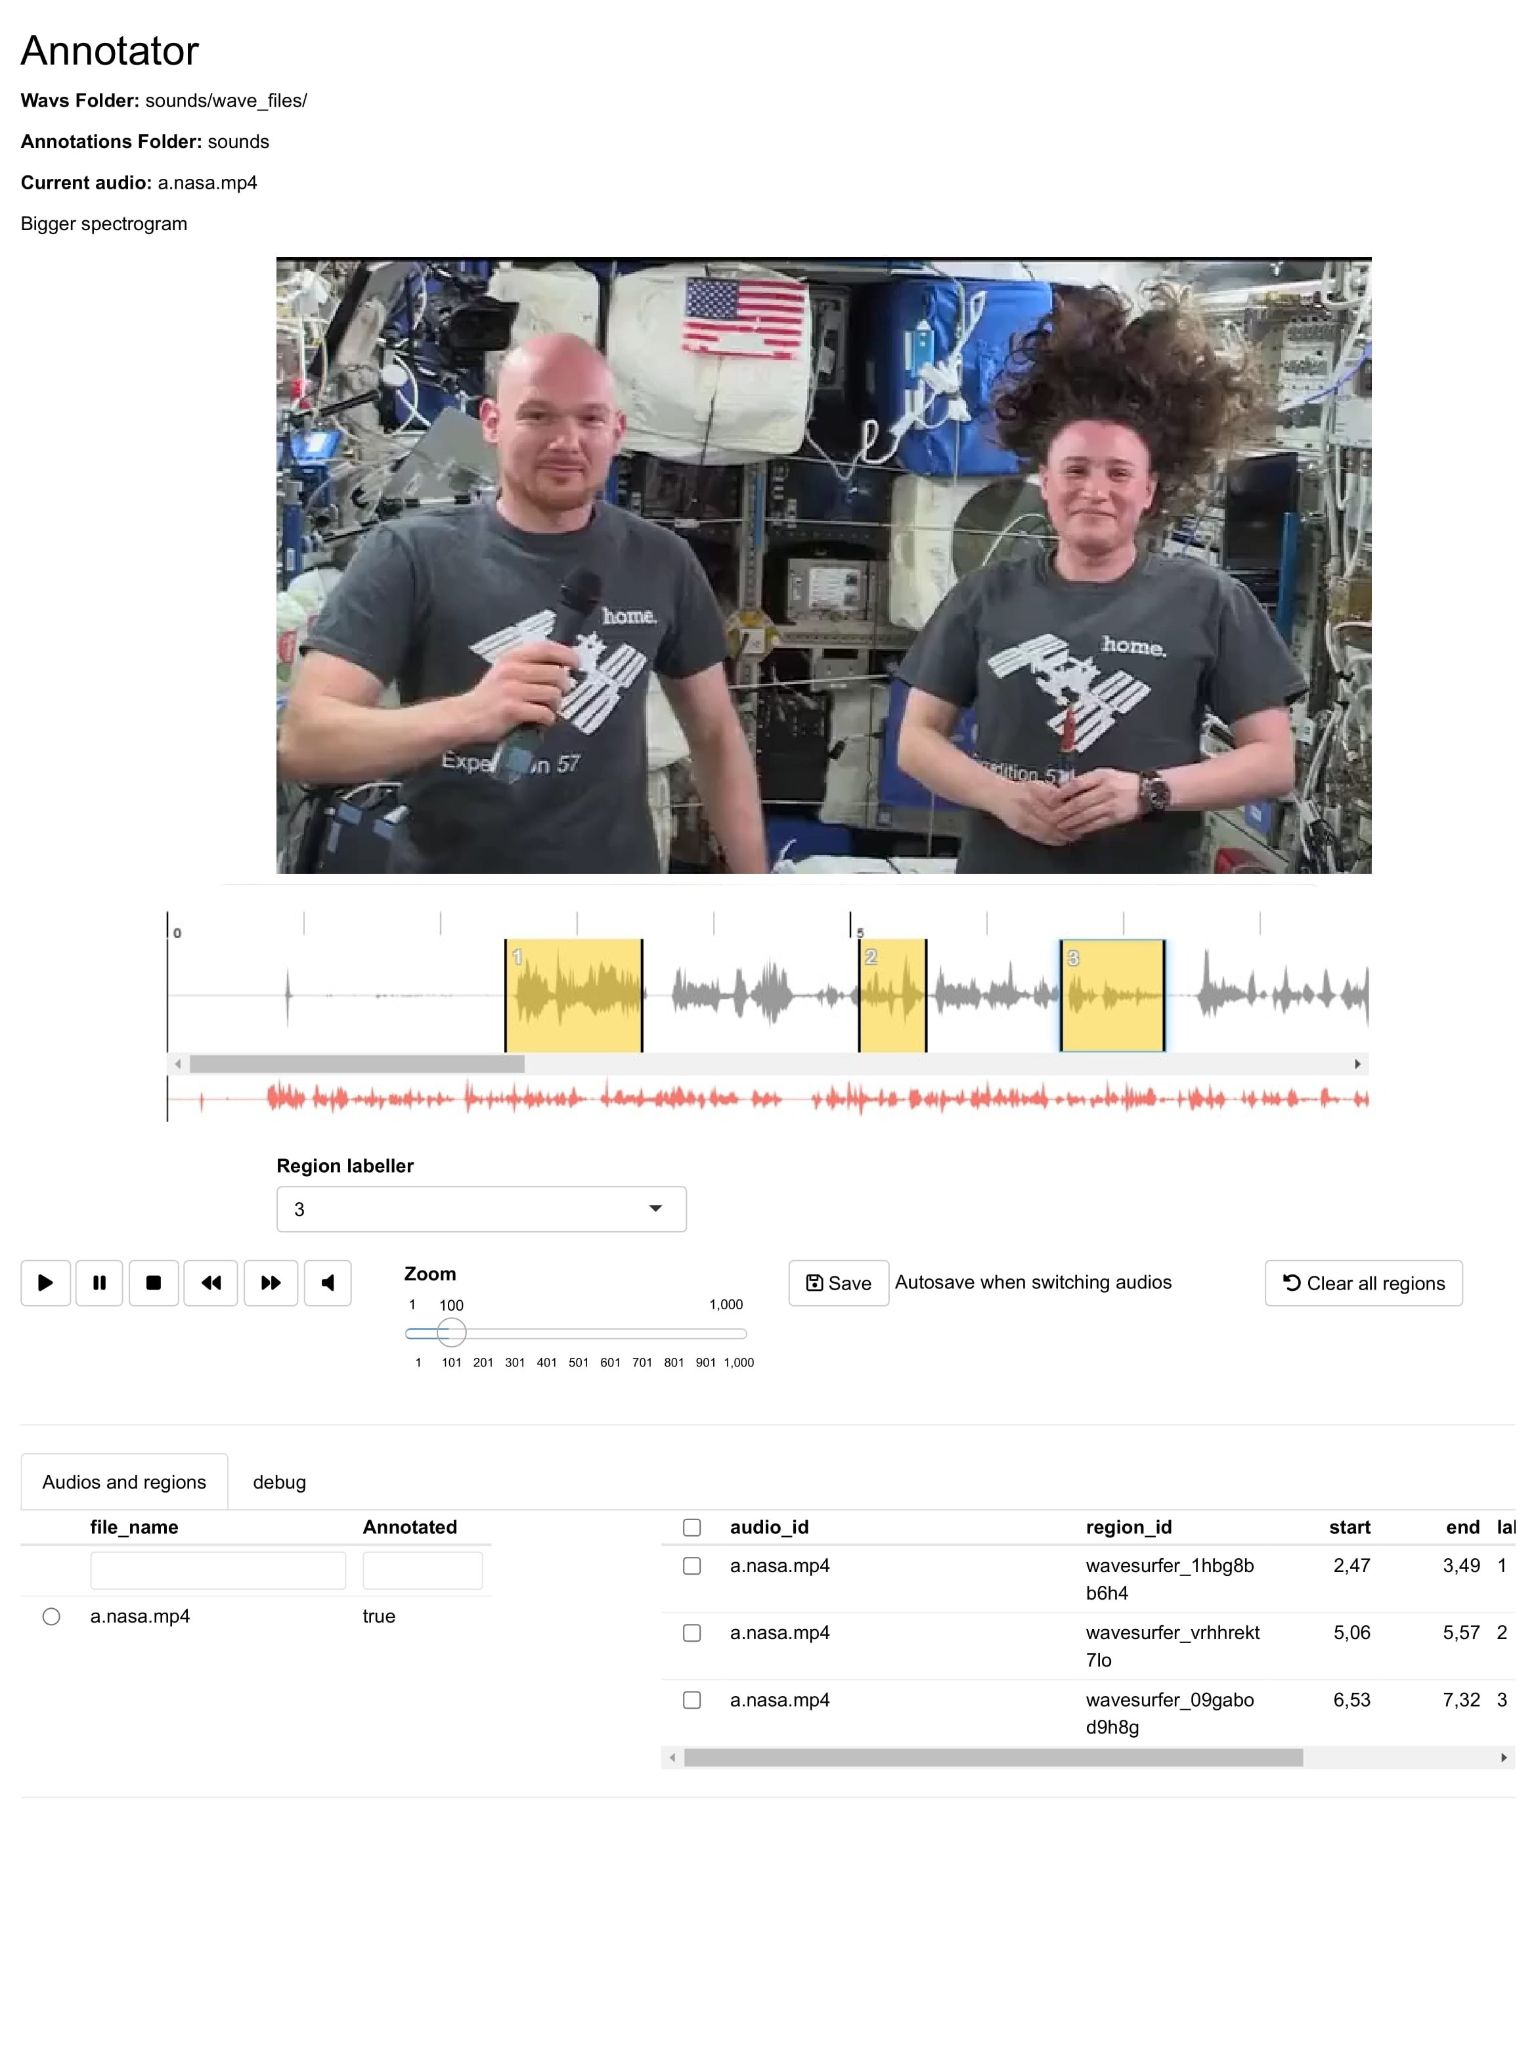
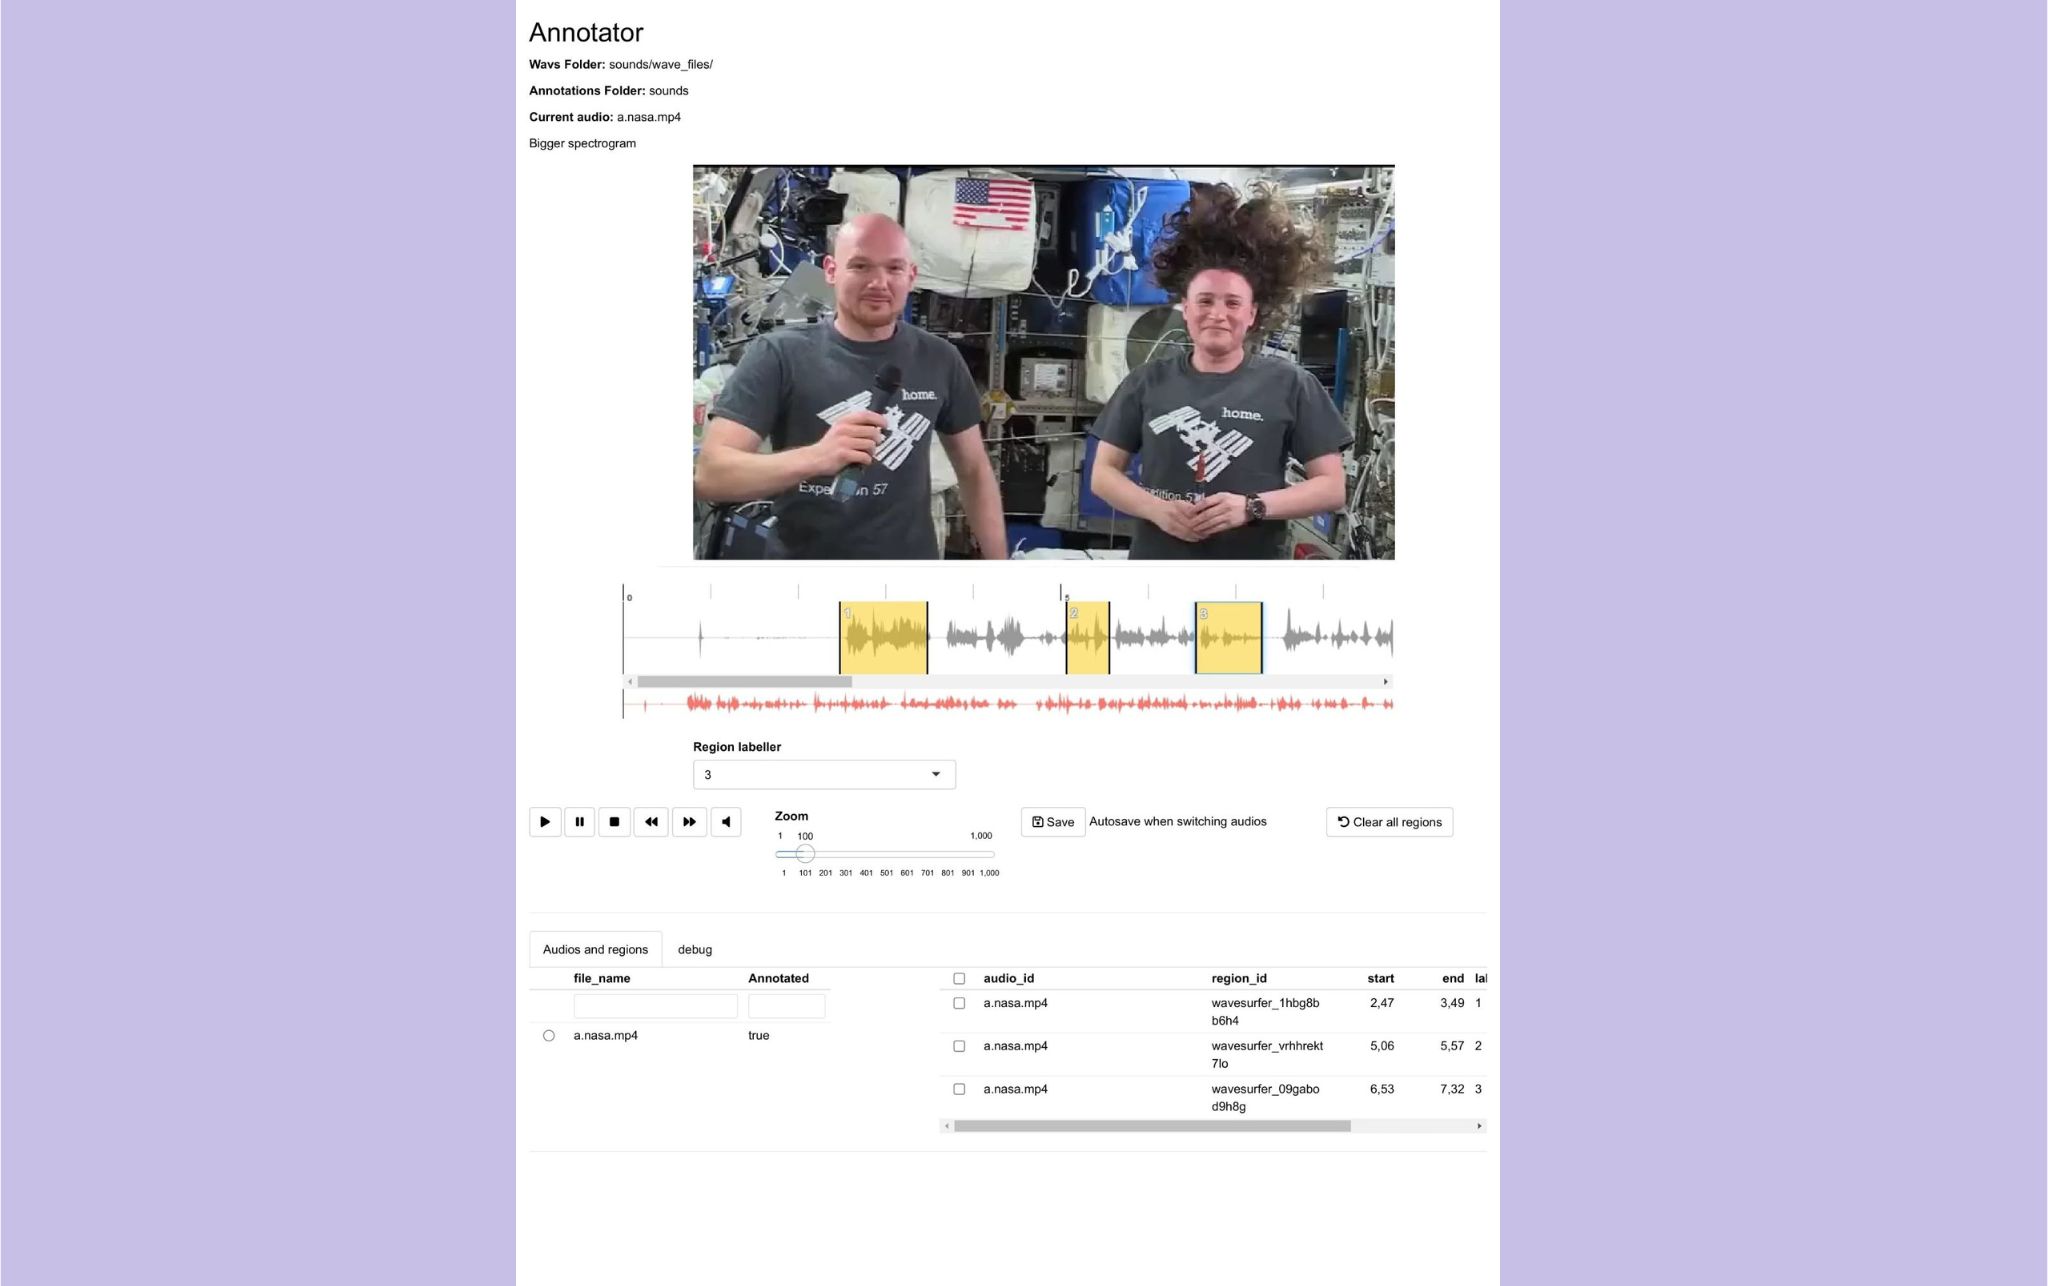
I worked in collaboration with Harvard researchers to develop an R package for video annotation. It's meant to help human coders (mturk, undergraduate RAs) identify different minute-long segments that are interesting in long clips. The package was originally developed by an R Studio author but only supported audio annotation. I developed the video annotation part using the {HTMLWIDGETS} package and my JS code.
My fork: https://github.com/ahmedjoubest/wavesurfer
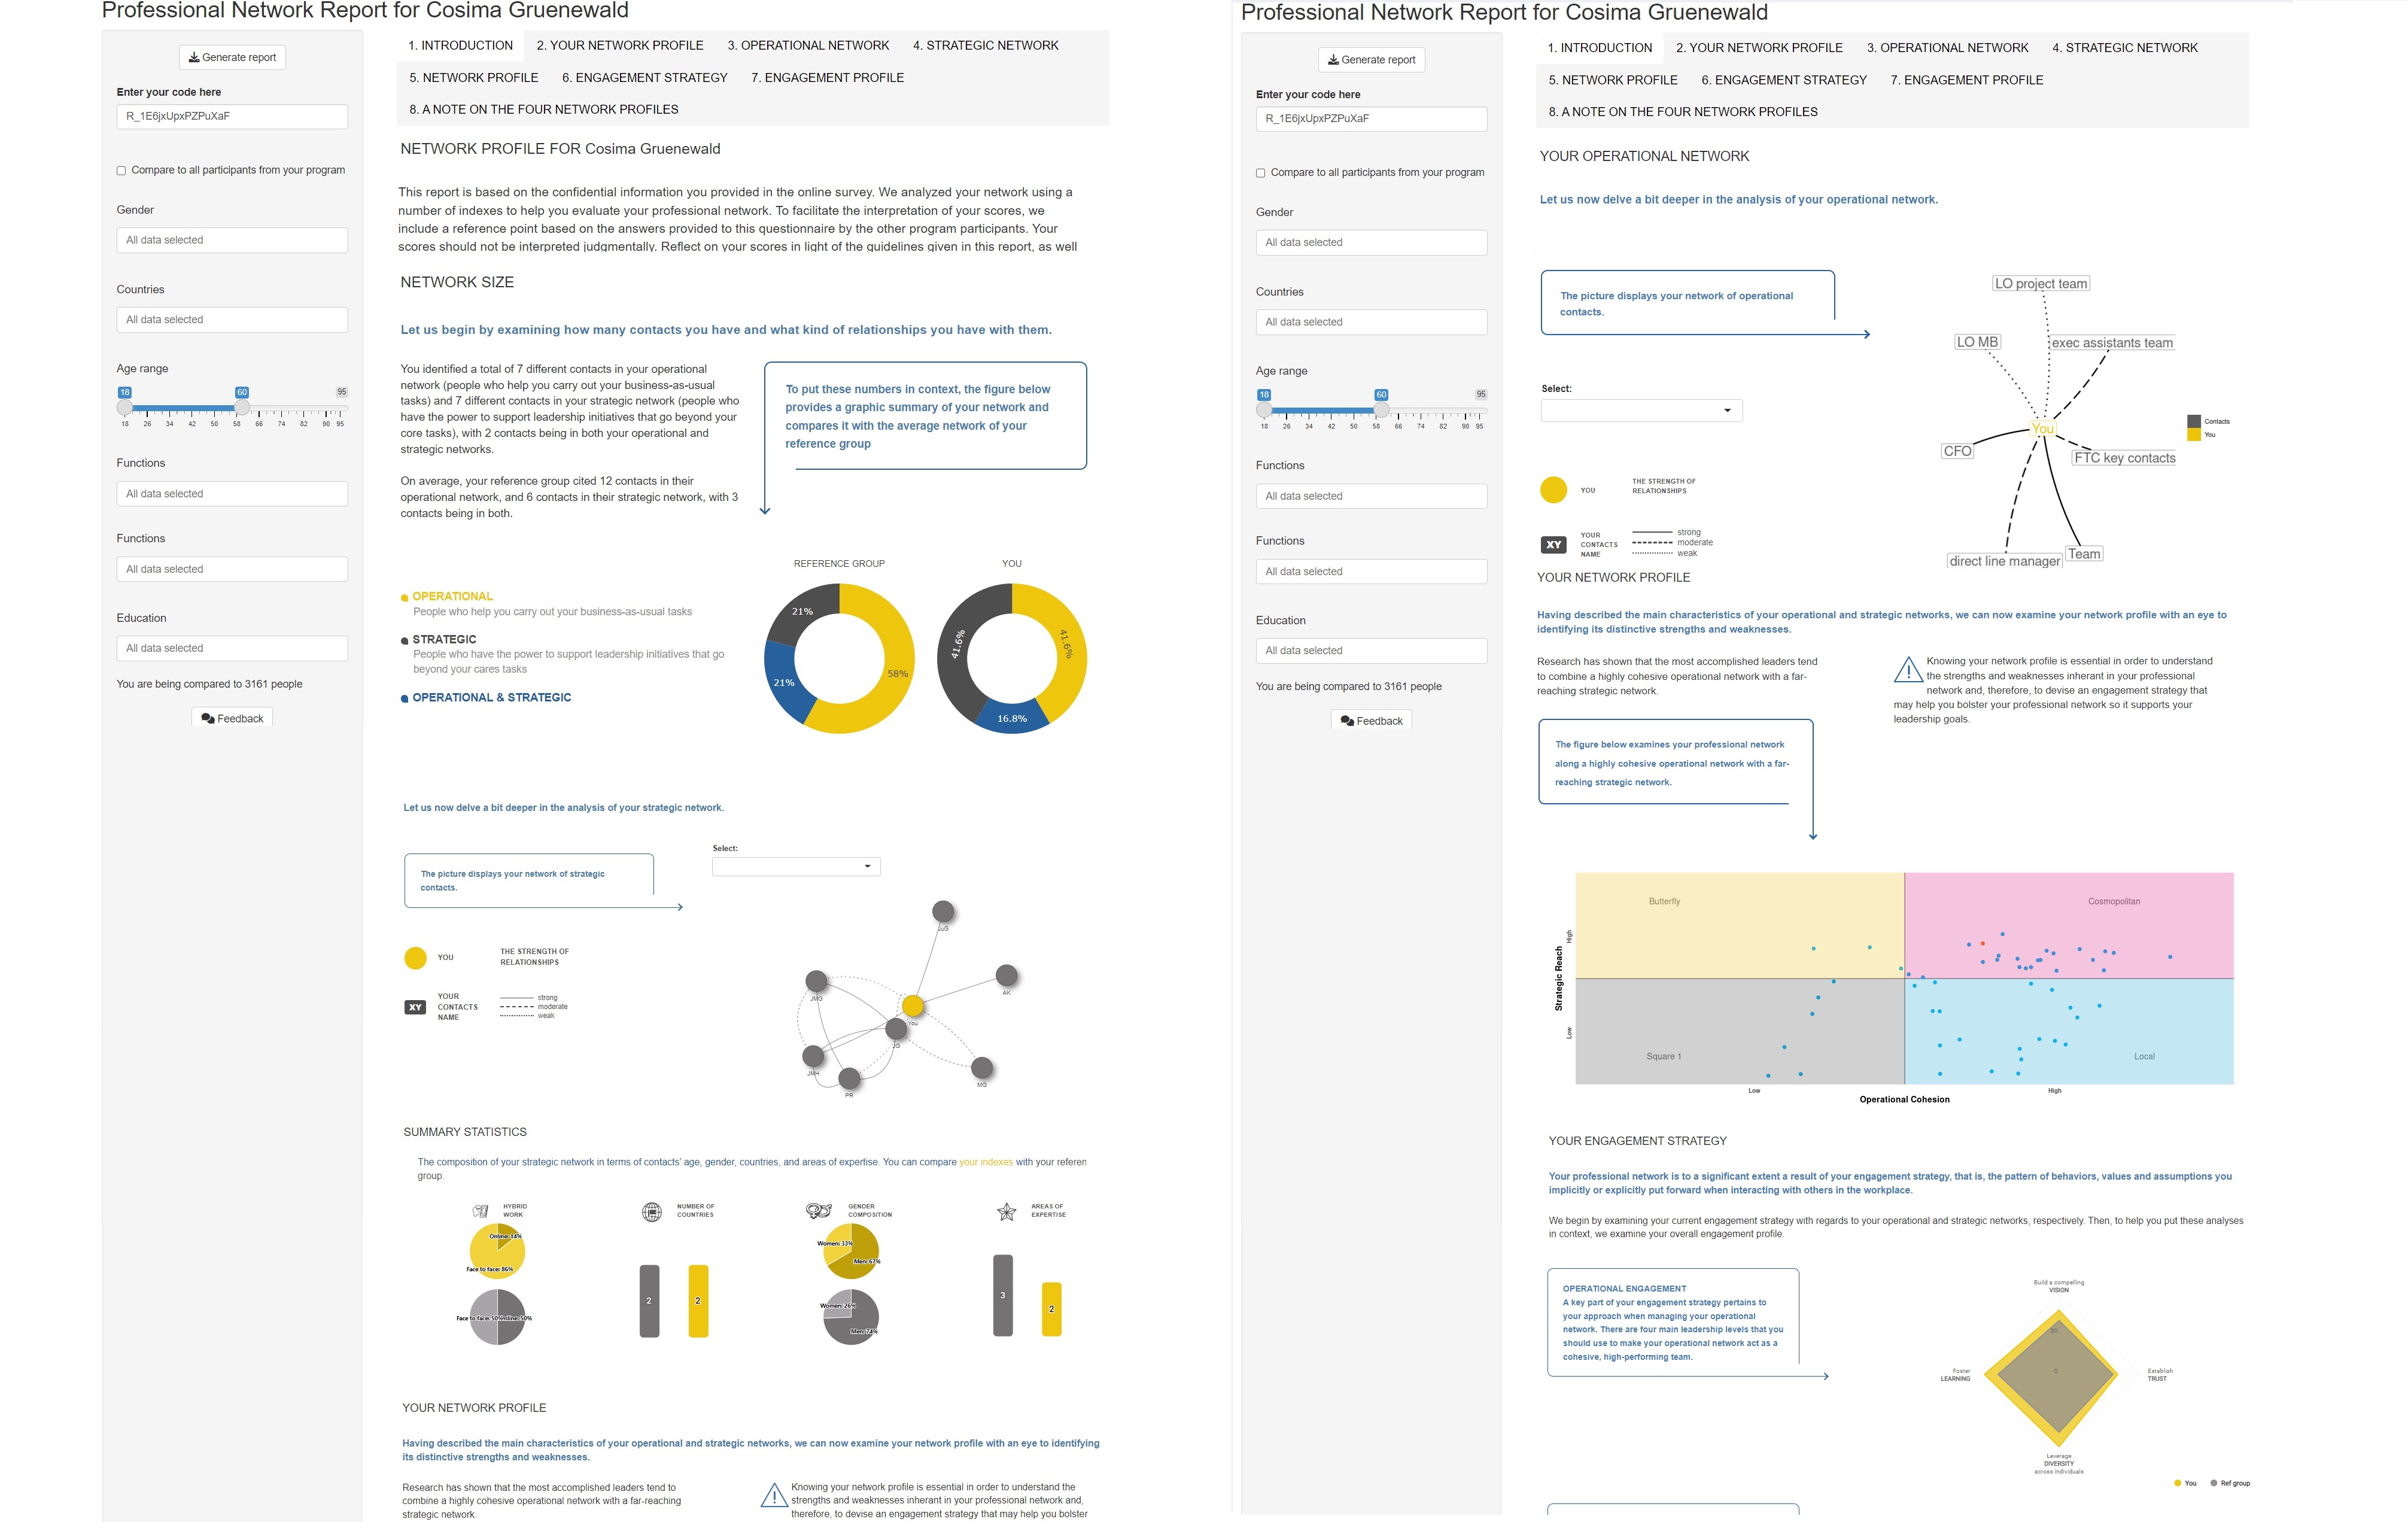
I created an R Shiny dashboard from scratch for the European School of Management and Technology in Berlin (ESMT Berlin) that allows students to have a better insight on their professional network based on cross-referenced answers to a Qualtrics form. An R script extracts the data from the Qualtrics database and renders it for the participants in the form of explanations and visualizations in the Shiny app.
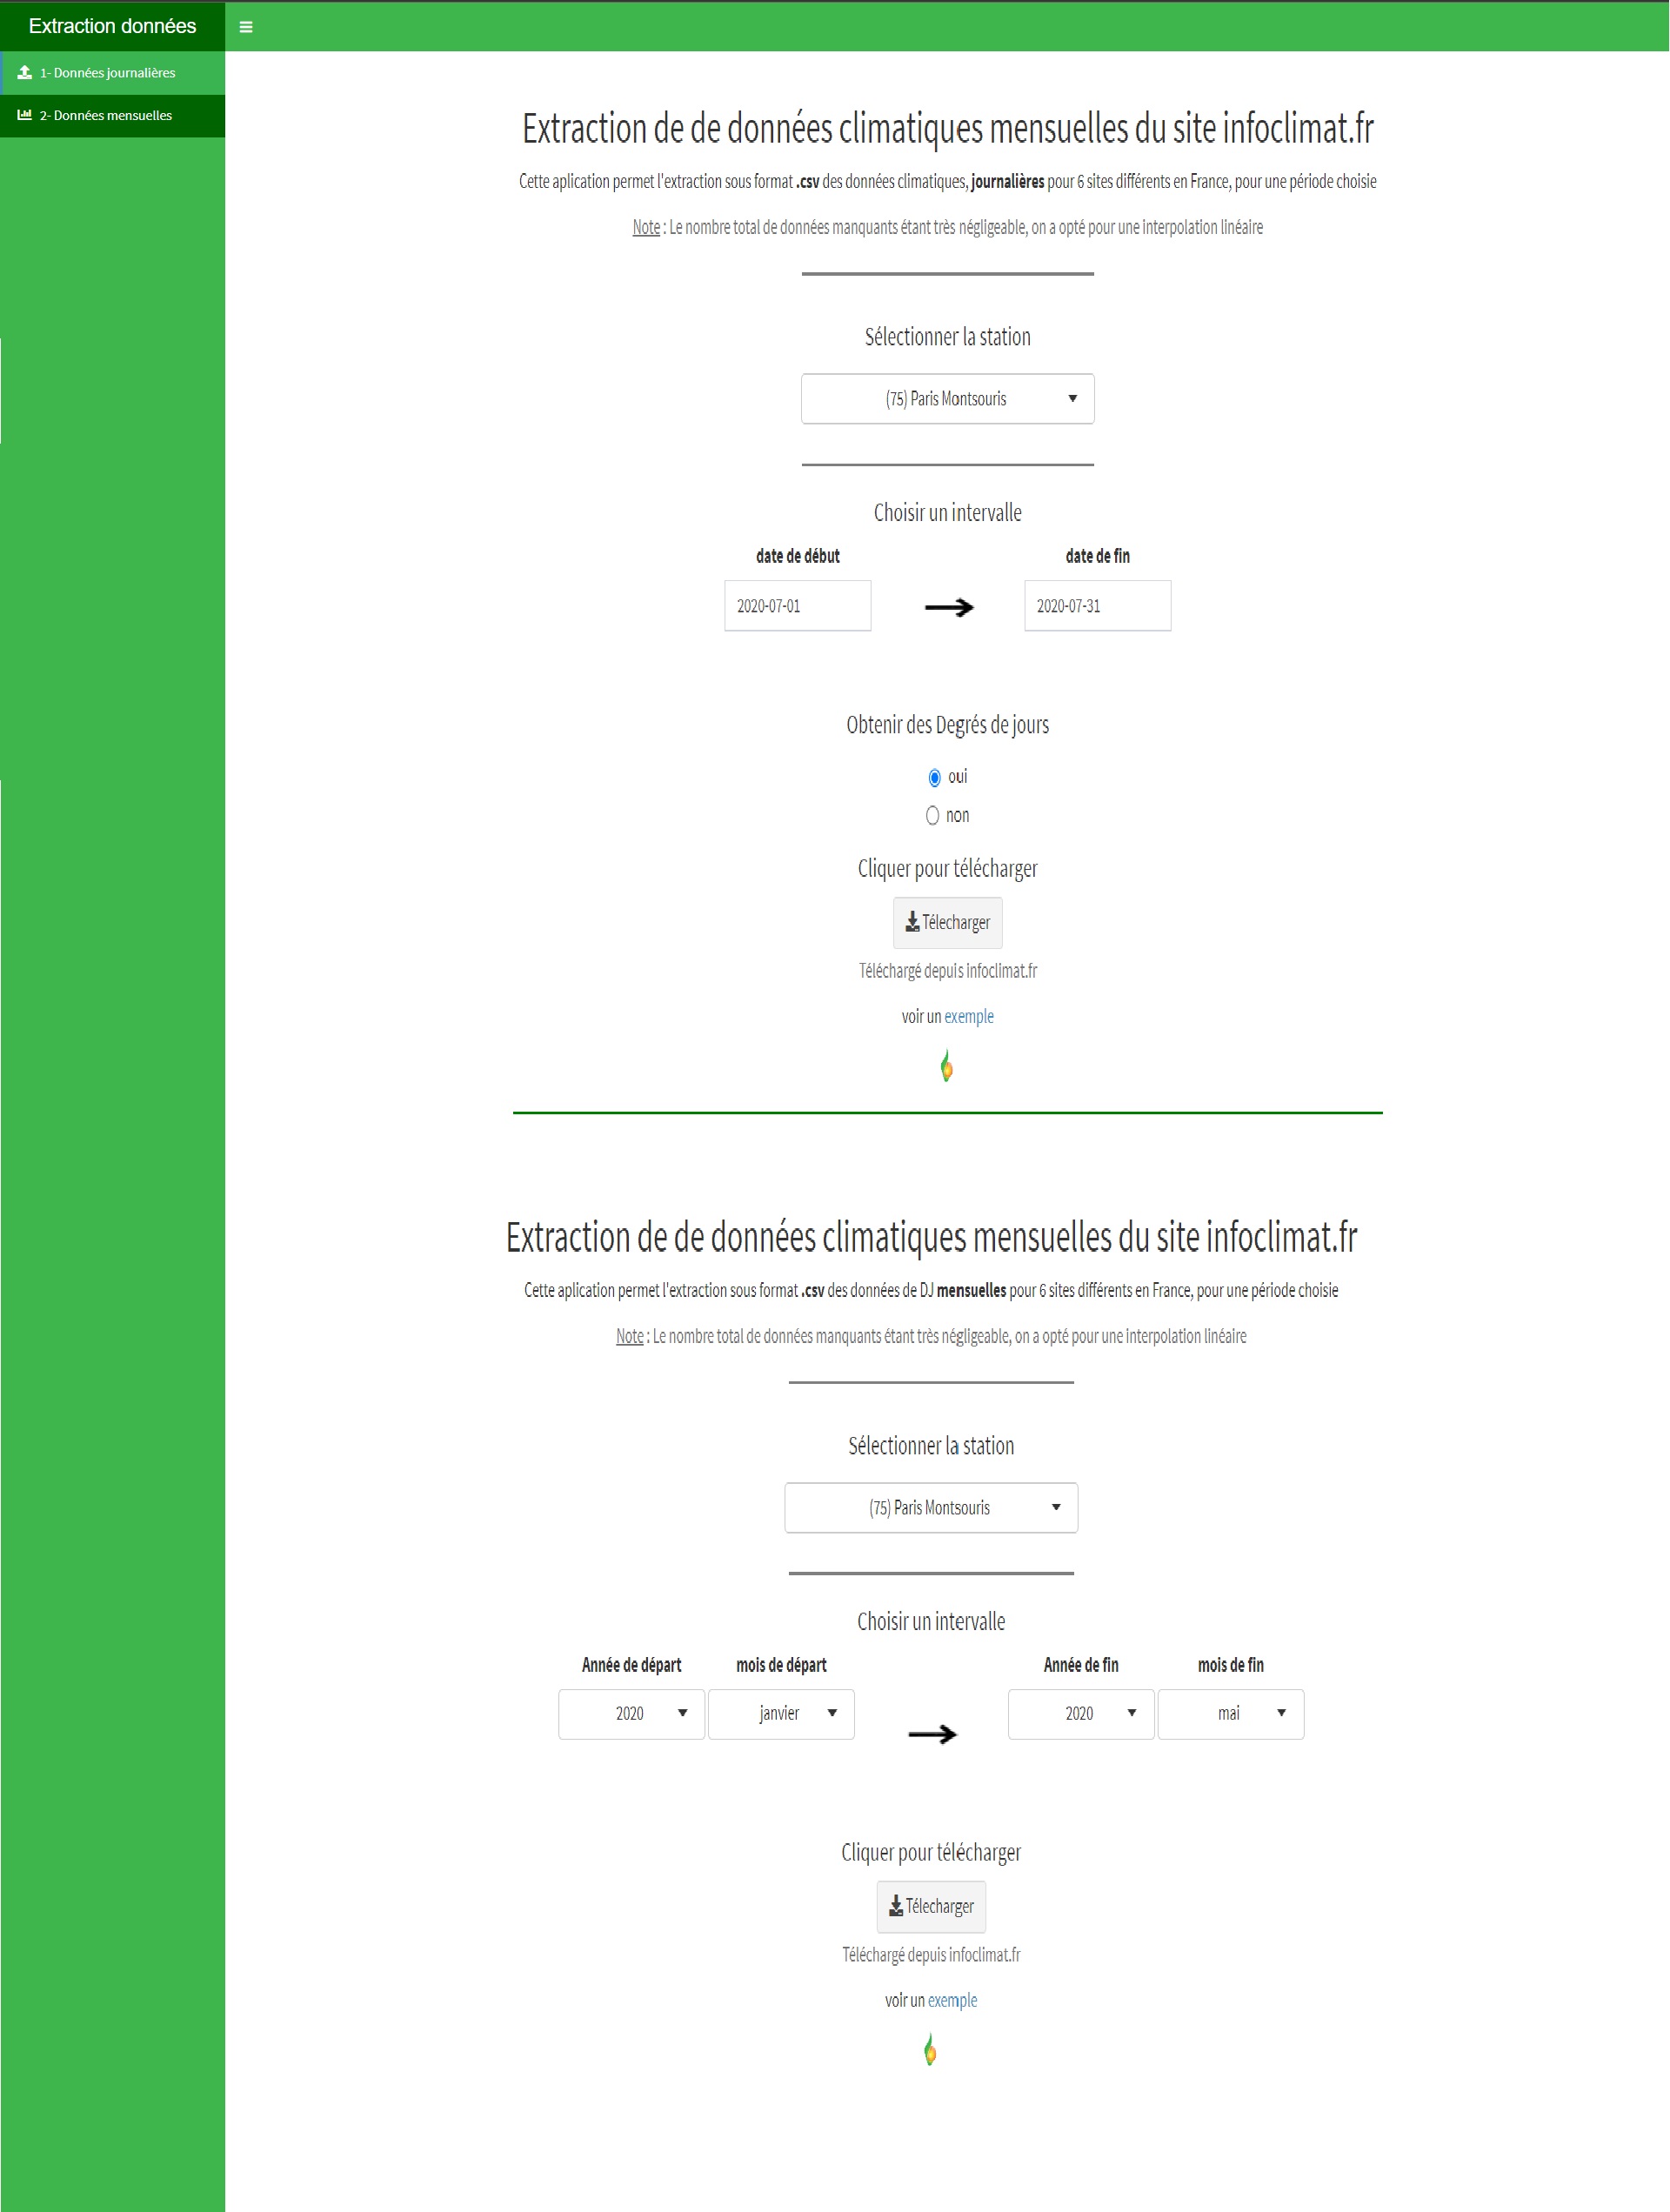
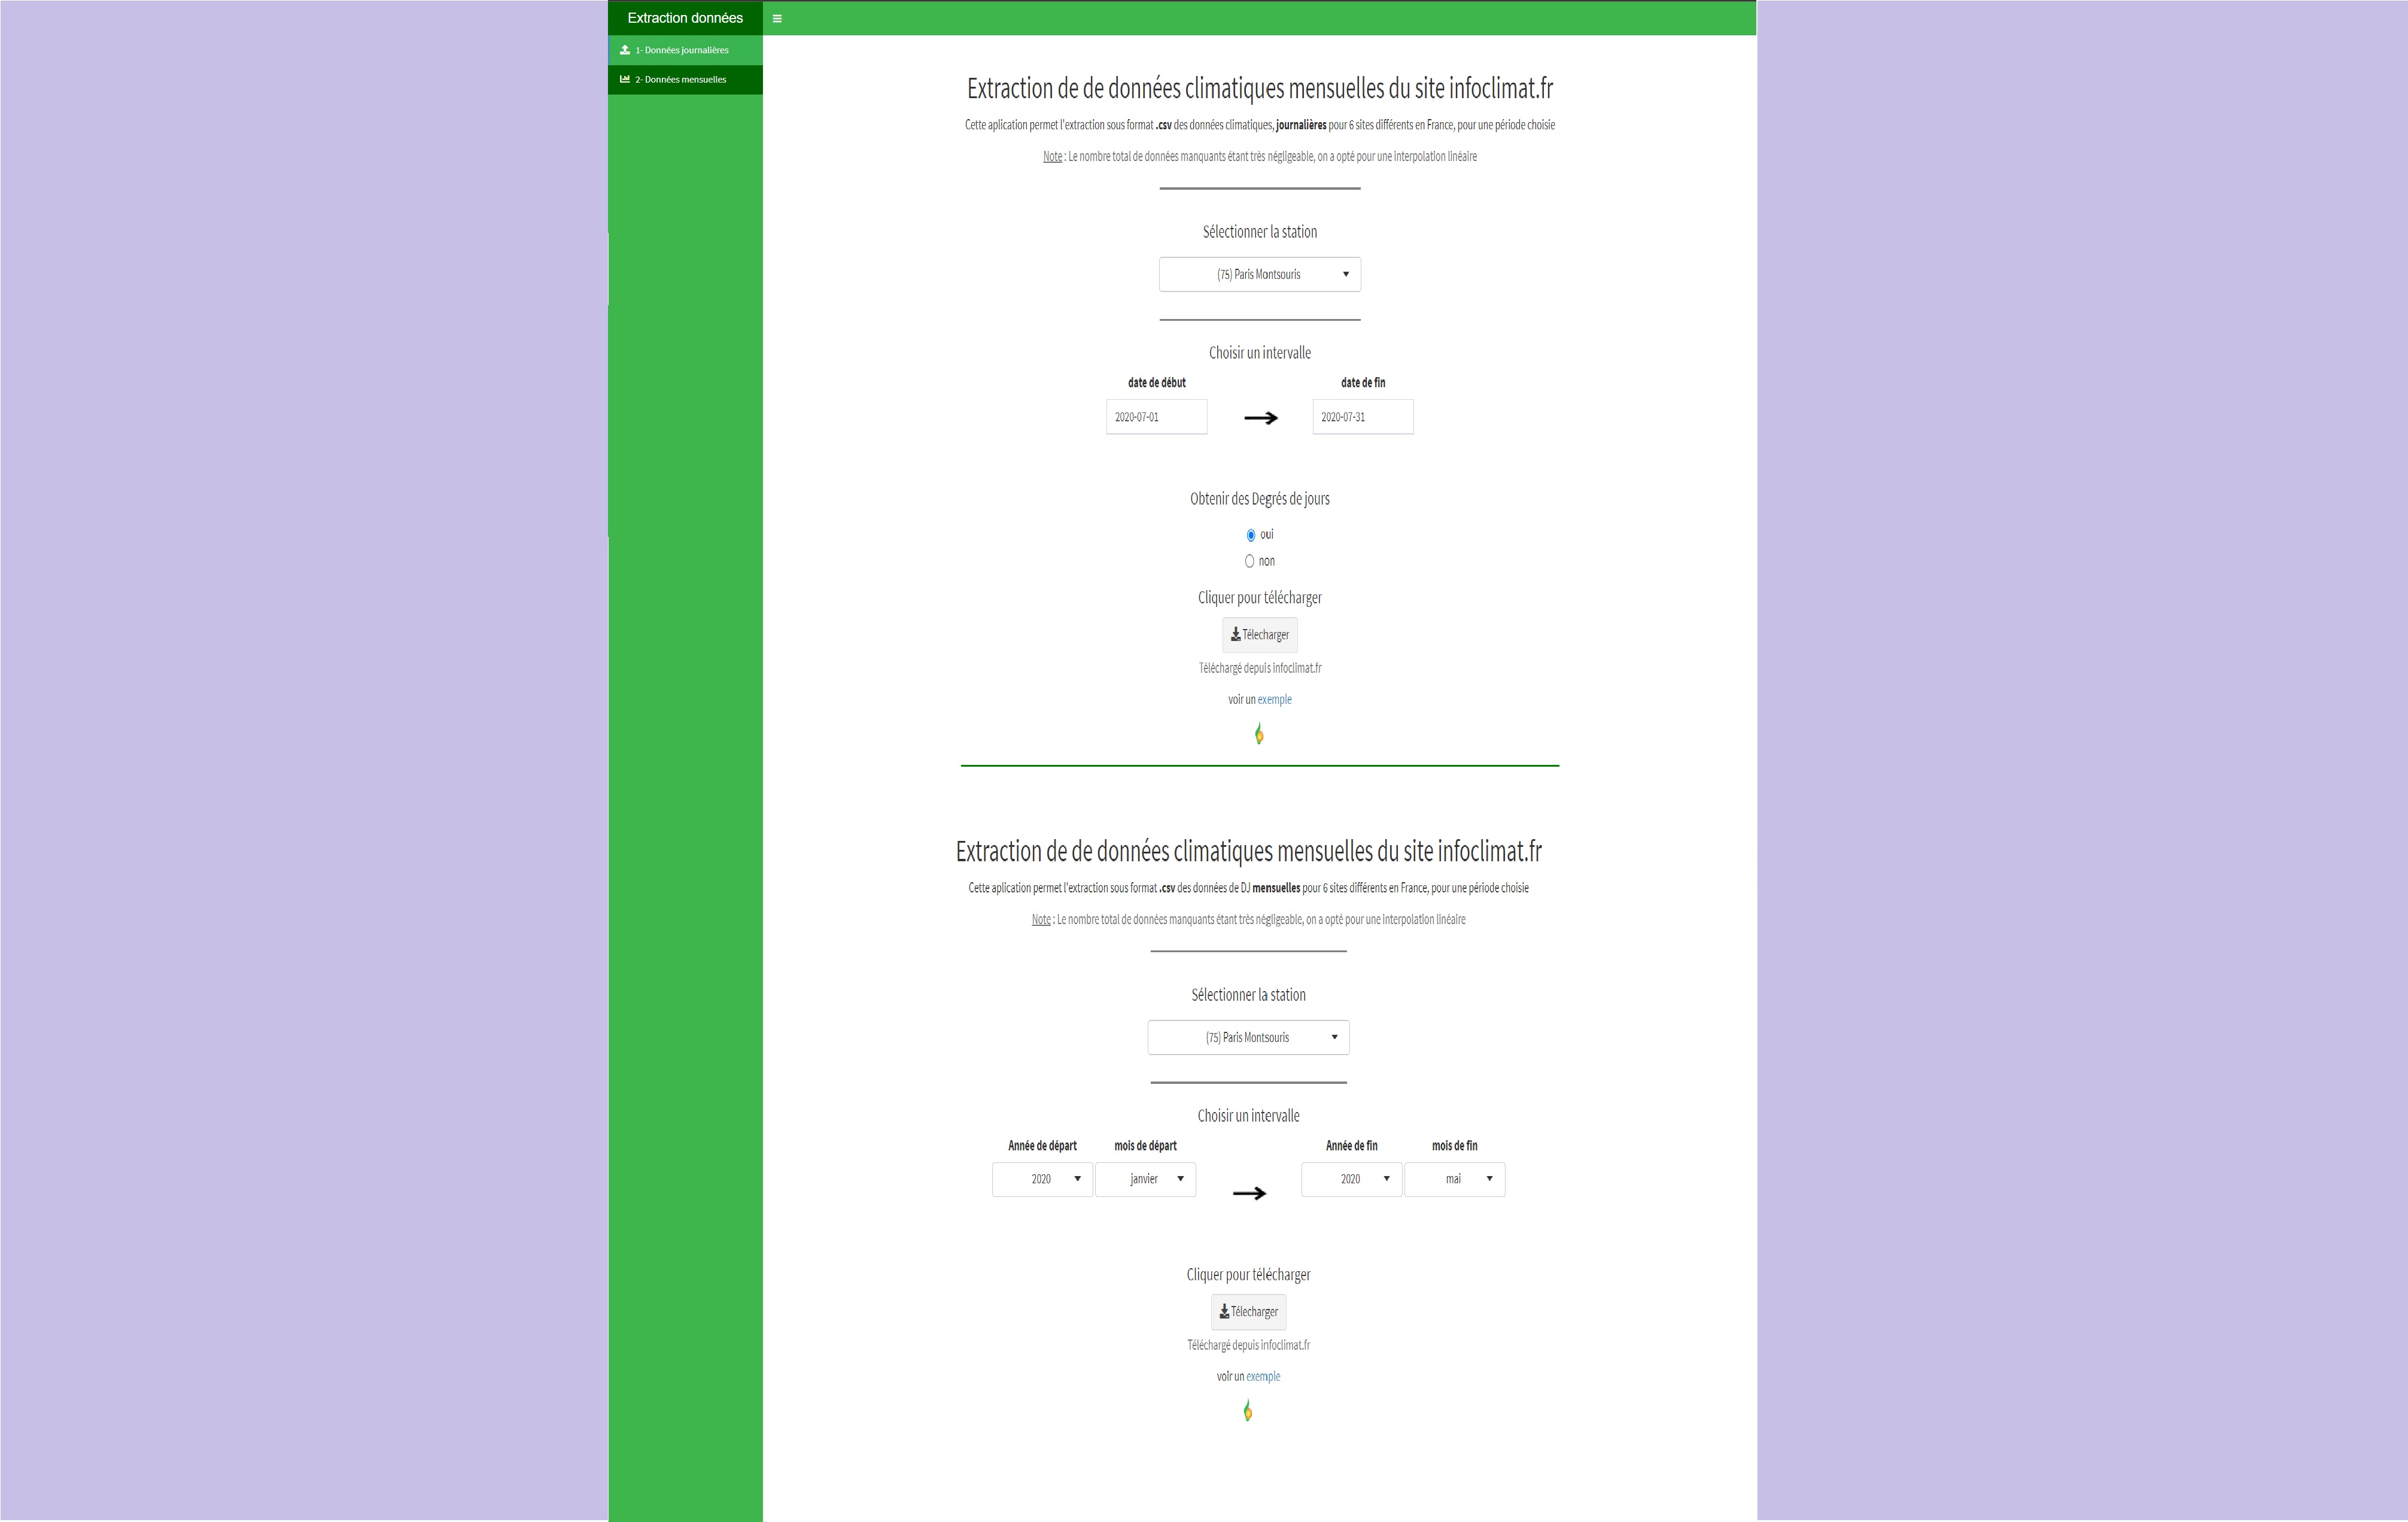
This application, which is based on Web Scraping technology, makes available in Excel format the climatological data for the city and the period of choice, as well as the corresponding DJU calculations. The data that comes from the French climatology website (infoclimat.fr) via Web Scraping is updated every minute with a Linux Cron JOB, making the extraction data updated in real time. This tool helps my client (an energy company) save time and avoid manual data entry.
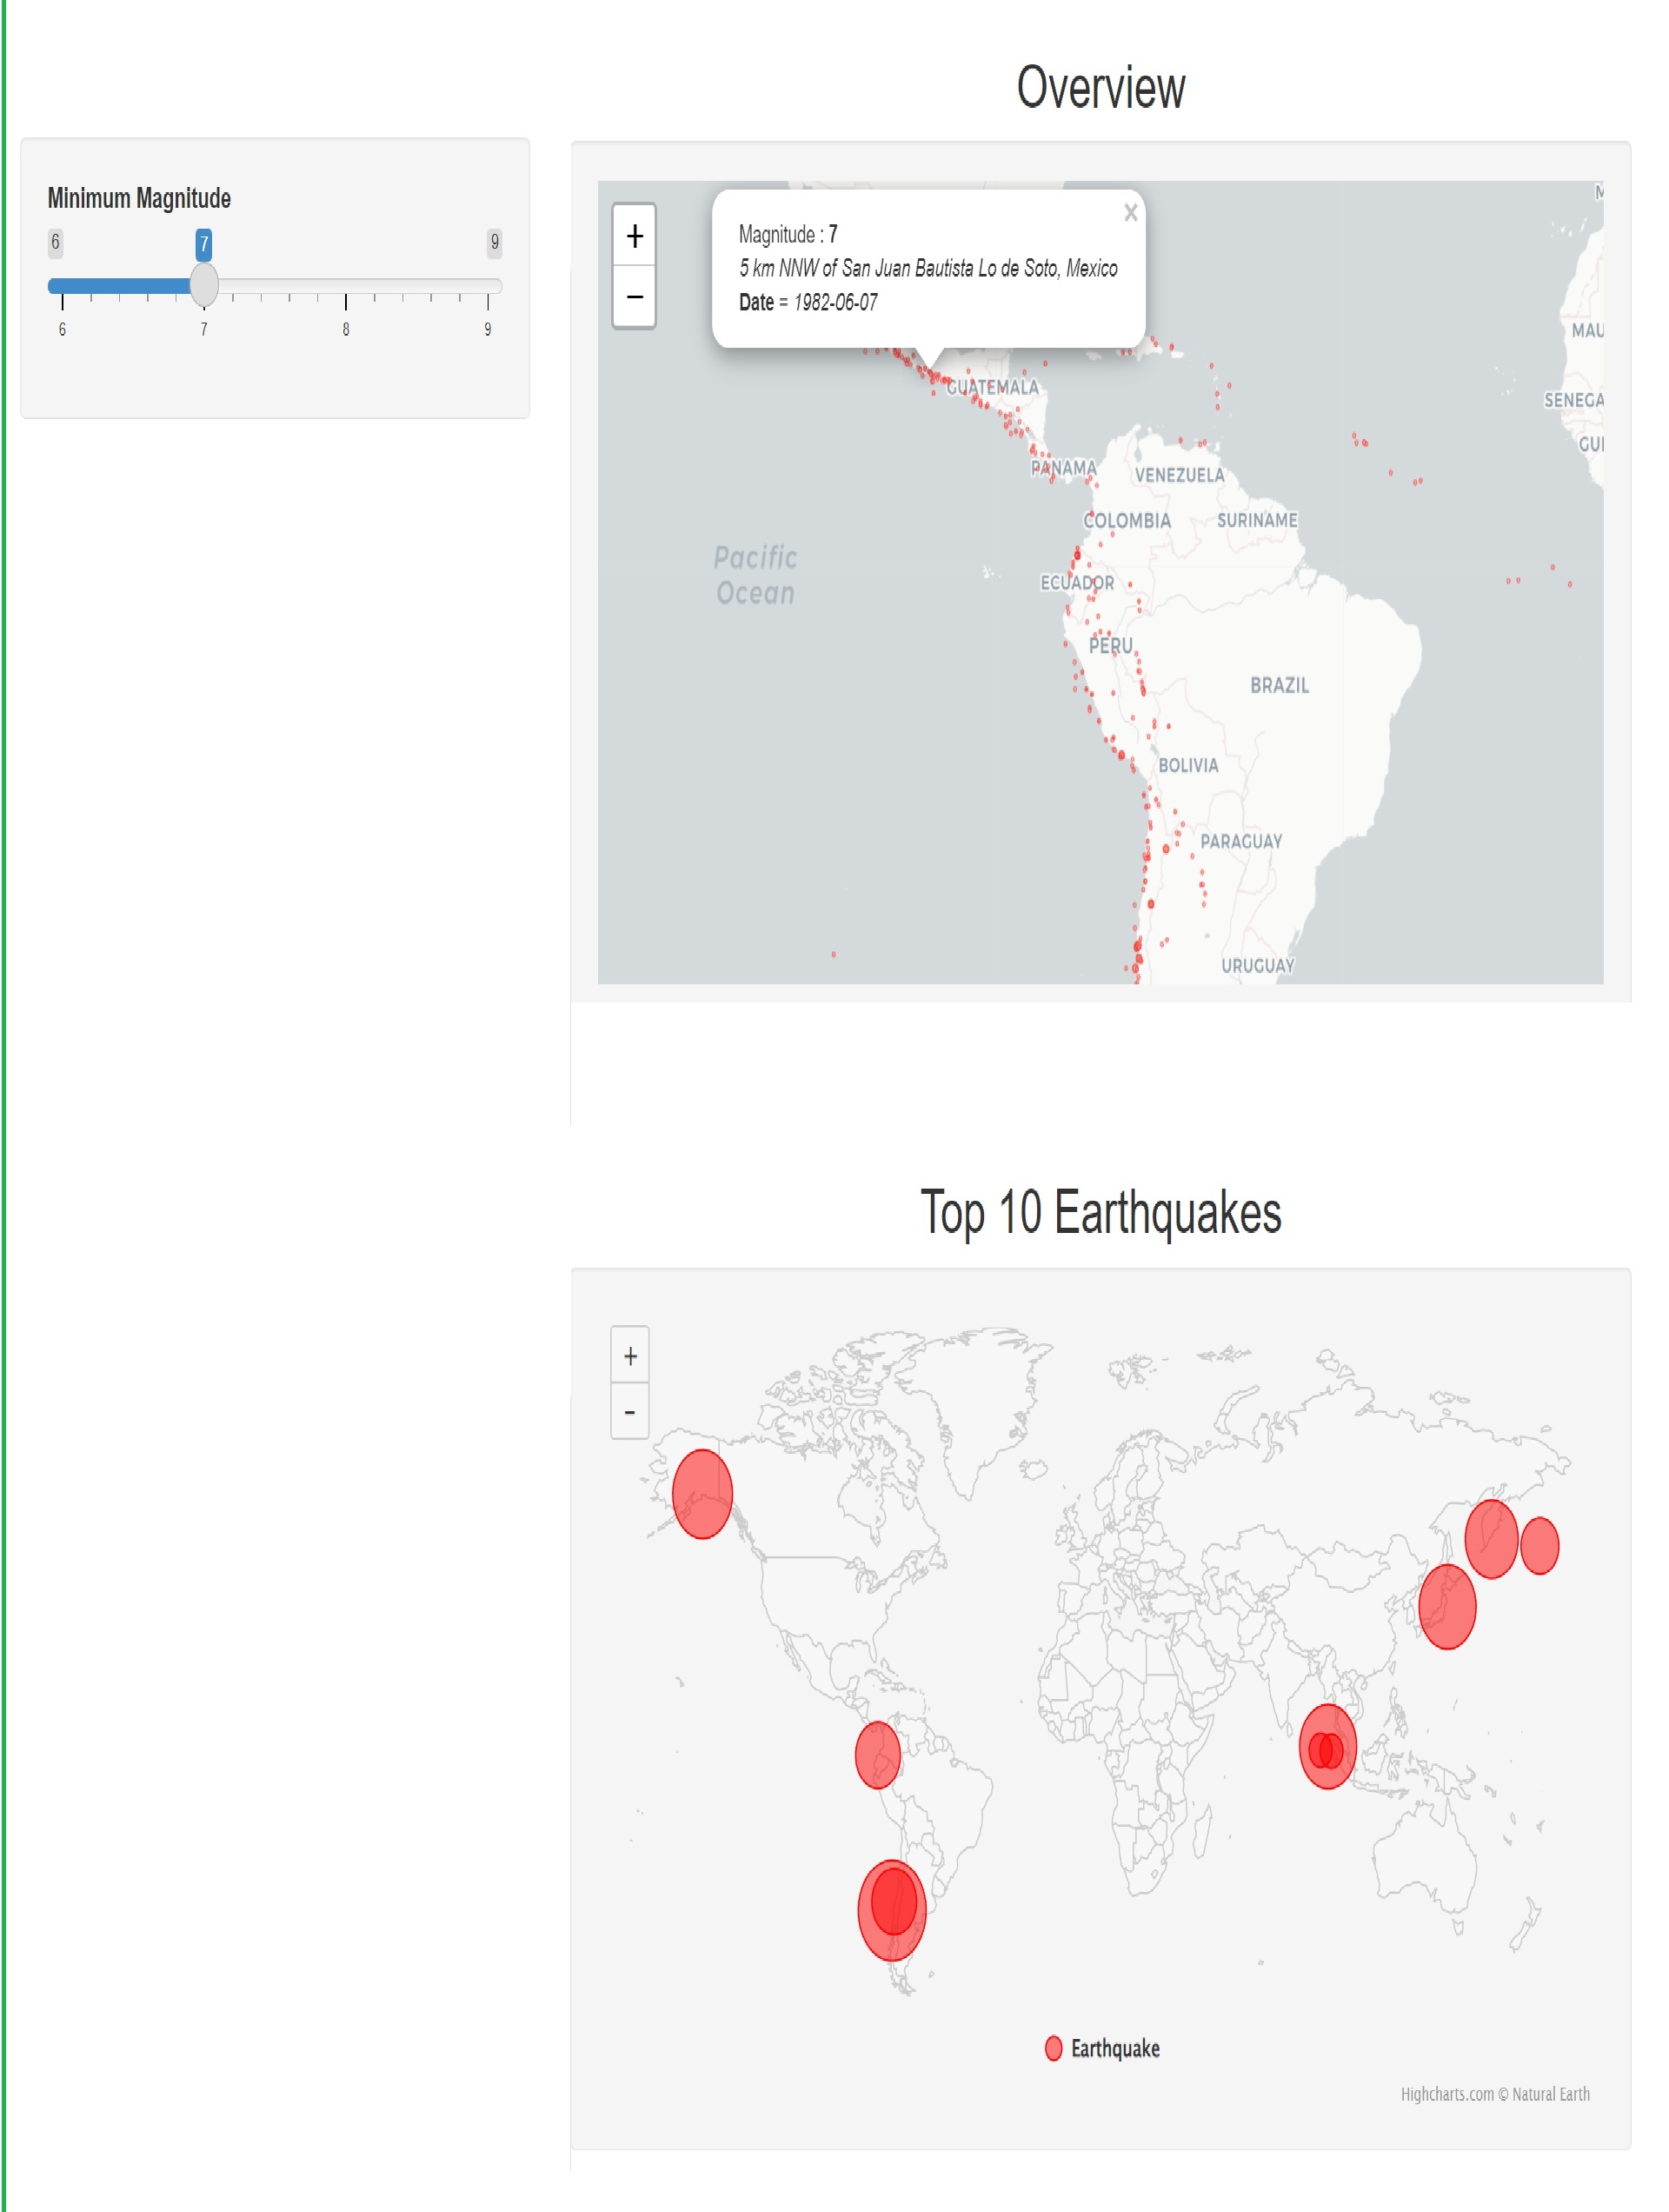
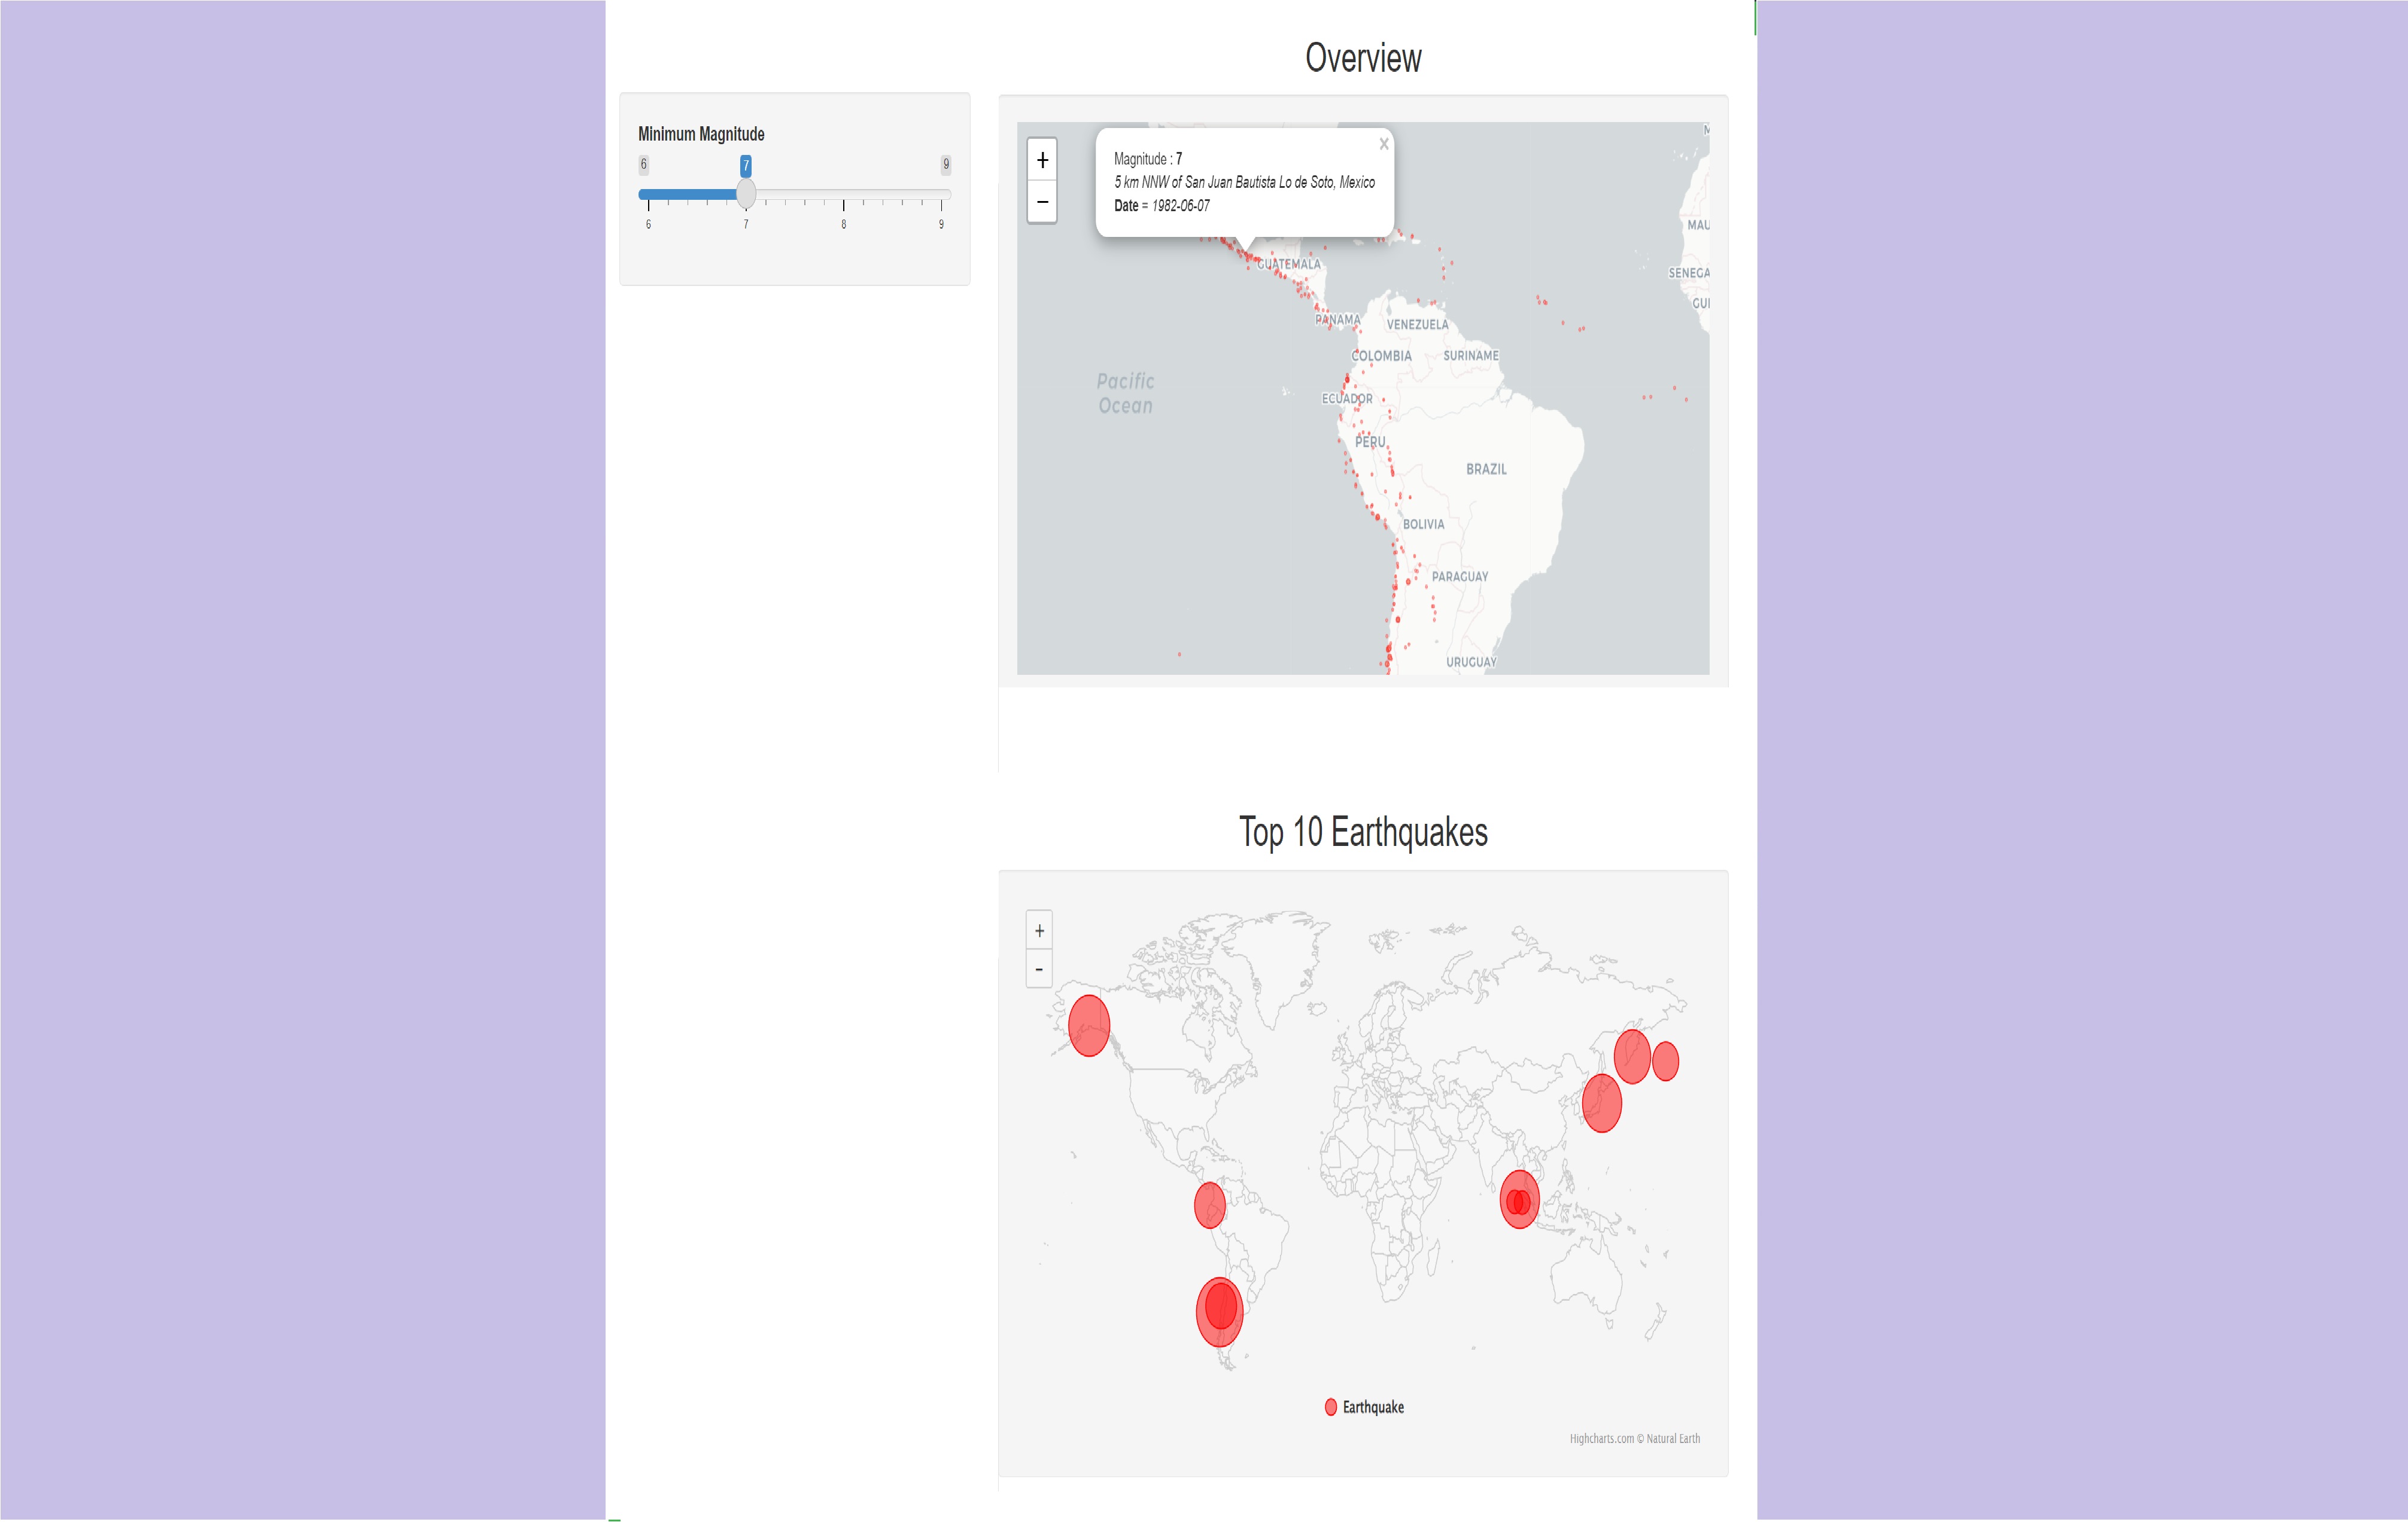
Project link: https://ahmedjouwork.shinyapps.io/Earthquake_Analysis/
In my beginnings, I developed this Dashboard to evaluate the consistency of the idea of implementing pure JS code in the R Shiny environment for data visualization. The results: it turns out that the use of pure JS code is not quite adequate for reasons of reactivity and responsiveness. The use of the {Highcharter} package of R has instead been better.
I found out later about the existence of the {HtmlWidgets} package that bridges R and JavaScript, allowing users to bring the best of JavaScript data visualization to R.
Ongoing project, access on demand: https://ahmedjouwork.shinyapps.io/Algo_trading-Backtester_V5/